Uber is trading at a discount because of AI fears — and these fears are valid. Shares are down roughly 19% over the past year, from an all-time high near $100 in October 2025 to the low-$70s today, even as the company keeps growing revenue, net income, and free cash flow every quarter. So what gives?
Why Is Uber Stock Down in 2026?
Investors are nervous about how Uber navigates a robotaxi future. Will Uber build its own robotaxi to compete with Google's Waymo or Amazon's Zoox? These fears are valid, because autonomous vehicles may eventually replace the human contractor drivers Uber's marketplace is built on. That overhang has only gotten louder in the past few weeks: reports surfaced that Waymo may end its exclusivity arrangement with Uber in Atlanta and Austin, and Uber has been cutting customer service jobs as it leans further into AI. Both headlines have weighed on the stock, with Bank of America trimming its price target to $103 even as it maintained a bullish long-term view.
Not everyone agrees the sell-off is warranted. Several Wall Street analysts have pushed back on the disruption narrative in recent weeks, arguing the market fear around robotaxis is overblown and reiterating Buy ratings with AV upside as a catalyst rather than a threat. The average 12-month analyst price target sits well above where the stock trades today.
Uber: The Aggregator of Rideshare Demand
Here's the other side of the robotaxi story: Uber may simply stay the aggregator of rideshare demand. Just like Zillow aggregates demand to buy a house or find a rental, Amazon aggregates e-commerce spend, Google aggregates information through search and Gemini, and Facebook aggregates social media and advertising — Uber aggregates rideshare demand. And the company isn't standing still; it's expanding into adjacent services through Uber Eats for food delivery and Uber Freight for logistics.
How I Found Uber as Undervalued
The Value Finder on youdomo.com automatically flags stocks that are growing financials faster than competitors while trading at valuation ratio discounts compared to industry averages. Other stock analysis tools give you a screener and leave all the filtering work on you. Instead, the YouDomo Value Finder automatically screens through over 3,500 stocks and finds these dislocated opportunities for you — saving time and surfacing new investment ideas. As of recording, the Value Finder had detected 55 other high-value opportunities. It's the same tool that helped me find stocks like ICLR and INSP before this one.
AI Fear or Opportunity? Two Robotaxi Futures
There are two major scenarios for the future of rideshare:
- Scenario A — every robotaxi player builds its own app. Users end up with a Zoox app, a Waymo app, a Tesla robotaxi app, and so on. Each app runs its own demand and pricing algorithm, has a restricted fleet of company-only cars, and covers a different footprint — one robotaxi service might only operate in Austin, TX, while another is only in Seattle, WA.
- Scenario B — Uber (and Lyft) become the aggregator of demand for rideshare, the same way Expedia or Booking.com aggregate demand for vacation planning. Uber shows riders multiple robotaxi competitors, and maybe even its own robotaxi, to compete for the trip. That's a better experience for the user, because the rider sees the best price and the marketplace promotes competition among providers. The app also keeps human drivers on the platform for counties and rural locations where robotaxis may not be economical for years.
The question isn't whether robotaxis arrive. It's whether Uber becomes the storefront they're sold through, or gets bypassed entirely.
Business and Financials: Growing While the Stock Slides
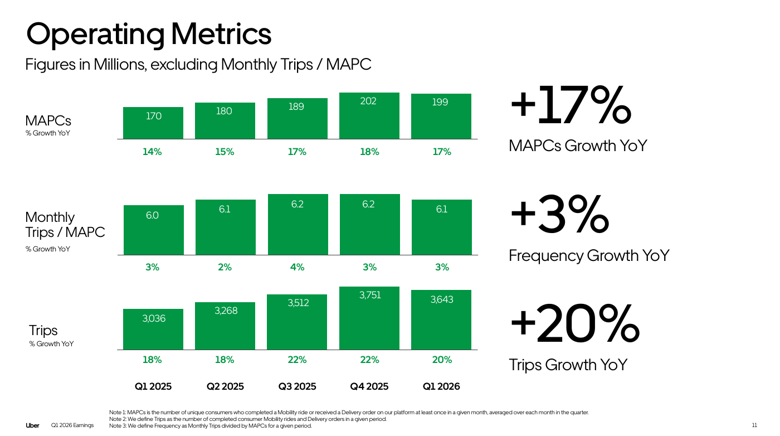
Uber is a company growing operations and financials even as the stock has slid roughly 19% over the past year. The number of unique consumers who completed a ride or received a delivery order (Monthly Active Platform Consumers, or MAPCs) is up 17% year-over-year to 199 million in Q1 2026, compared to 170 million in Q1 2025. Trips are up 20%, from 3.0 billion to 3.6 billion. There's clear, broad-based demand growth across Uber's core Mobility and Delivery businesses.
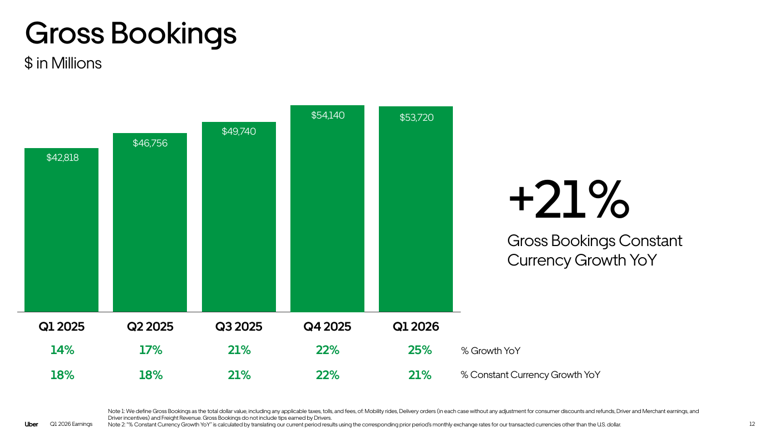
Gross Bookings — the total dollar value of mobility rides and delivery orders on the platform — grew 21% year-over-year on a constant currency basis in Q1 2026, reaching $53.7 billion. Revenue for the quarter came in at $13.2 billion, up 14% year-over-year, with Delivery the fastest-growing segment at $5.07 billion in revenue, up 34% YoY.
Uber Fundamentals: From Cash Burn to Free Cash Flow Machine
Using the YouDomo API, you can pull financial data for over 3,500 stocks — annual and quarterly balance sheet, income statement, and cash flow line items — and build out a full valuation picture in Excel in minutes. That's exactly how the story below comes together: revenue, net income, and free cash flow, all sourced directly from Uber's filings.
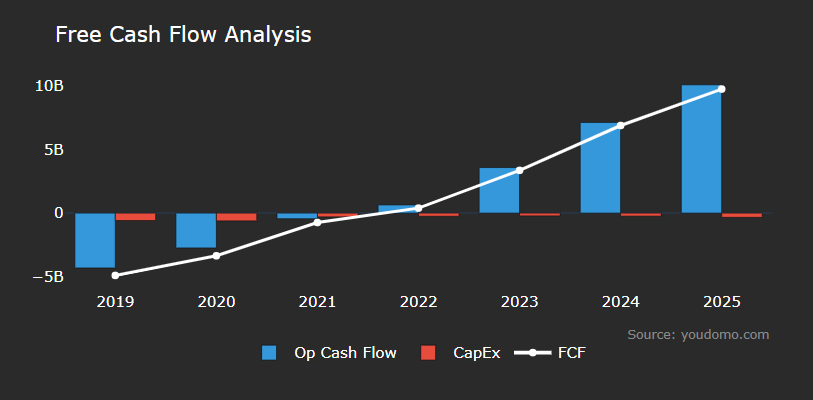
Uber's turnaround is one of the more dramatic in large-cap tech. The company posted its first-ever GAAP operating profit in Q2 2023, and CEO Dara Khosrowshahi called 2023 an "inflection point" for the business. Since then, Uber has become a consistently net income and free cash flow positive company — not just profitable on paper, but generating real cash. In Q1 2026 alone, Uber produced $2.4 billion in operating cash flow and $2.3 billion in free cash flow. On a trailing-twelve-month basis, free cash flow hit a company record of $9.8 billion.
GAAP net income for the quarter was $263 million, down from $1.78 billion a year earlier — but that swing has nothing to do with the core business. It's almost entirely explained by a $1.5 billion non-cash, pre-tax headwind from revaluing Uber's equity stakes in companies like Aurora, Didi, and Grab. Strip that accounting noise out and the underlying earnings power keeps climbing: Non-GAAP net income grew 39% to $1.5 billion, Non-GAAP EPS grew 44% to $0.72, and Adjusted EBITDA grew 33% to $2.5 billion, with margin expanding to 4.6% of Gross Bookings from 4.4% a year ago.
Looking ahead, Uber's own Q2 2026 guidance points to Gross Bookings of $56.25-57.75 billion (18-22% constant-currency growth) and Non-GAAP EPS of $0.78-0.82, which would represent 31-38% year-over-year growth. If Uber delivers anywhere near that range, it would mark yet another quarter where the fundamentals are moving in the opposite direction of the stock price.
Valuation vs. Return: What Price-to-Sales Predicts
Despite growing revenue, net income, and free cash flow every quarter, Uber's valuation multiples haven't kept pace — they've actually compressed. Uber's price-to-sales ratio currently sits around 2.7-2.8x, below its 3-year average of roughly 3.4x and its 5-year average of roughly 3.5x. In other words, the market is paying less per dollar of Uber's sales today than it has, on average, over the past several years, even though those sales — and the cash they convert into — are growing faster than they used to.
The YouDomo API makes it possible to plot a stock's forward return directly against its valuation multiple at the time. For Uber, that relationship with price-to-sales is clearly inverse: as P/S falls, one-year forward return has historically tended to rise. Correlation isn't causation, but the pattern is consistent — Uber's strongest forward stretches have shown up more often when the stock was trading at a valuation discount, not a premium.
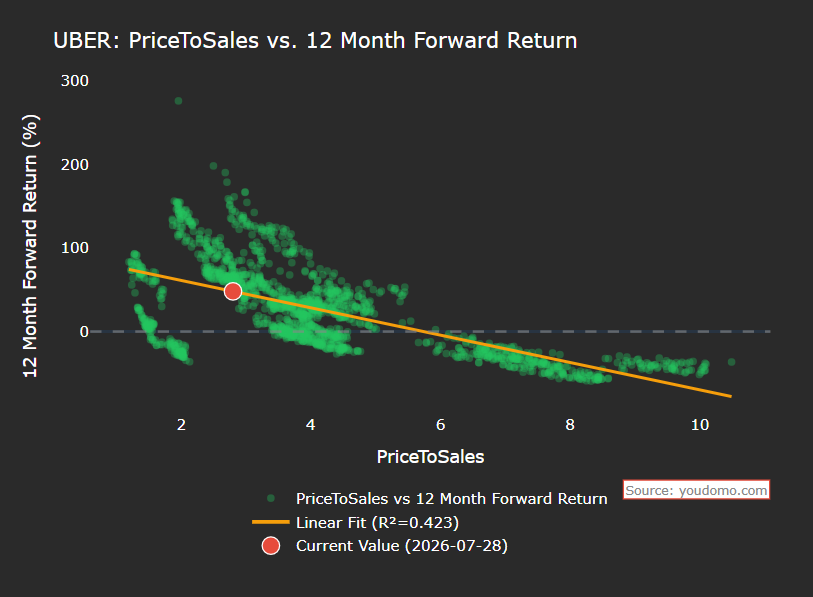
With Uber's price-to-sales sitting near the low end of its multi-year range today, this model leans bullish. As always, it's worth being clear-eyed about the sample: past correlation doesn't guarantee future returns, and Uber's public trading history only spans back to its 2019 IPO.
Final Verdict: Is Uber Stock a Buy or Sell in 2026?
Uber's 19% pullback over the past year looks more like a sentiment reset around robotaxis than a breakdown in the underlying business. Revenue, net income, and free cash flow are all growing, Uber generated a record $9.8 billion in trailing-twelve-month free cash flow, and price-to-sales is trading below its multi-year average at the same time the valuation-vs-return relationship has historically favored buyers at these levels. The real risk isn't Uber's current financials — it's whether robotaxi operators eventually bypass Uber's marketplace instead of listing on it. If Uber remains the aggregator of rideshare demand the way Expedia aggregates travel, there's a real case for meaningful upside from here.
This article is for information and education only and is not financial advice. Do your own research, or consult a licensed financial advisor, before making investment decisions. Past performance does not guarantee future results.