YouDomo is a stock analysis platform built to give every investor access to the financial data and tools that were once reserved for professionals with six-figure data subscriptions.
Our Mission
Professional investors have always had an edge: access to clean, structured financial data that makes it easy to evaluate a company's true health. Bloomberg terminals cost $25,000 a year. SEC filings are buried in dense PDFs. We built YouDomo to close that gap.
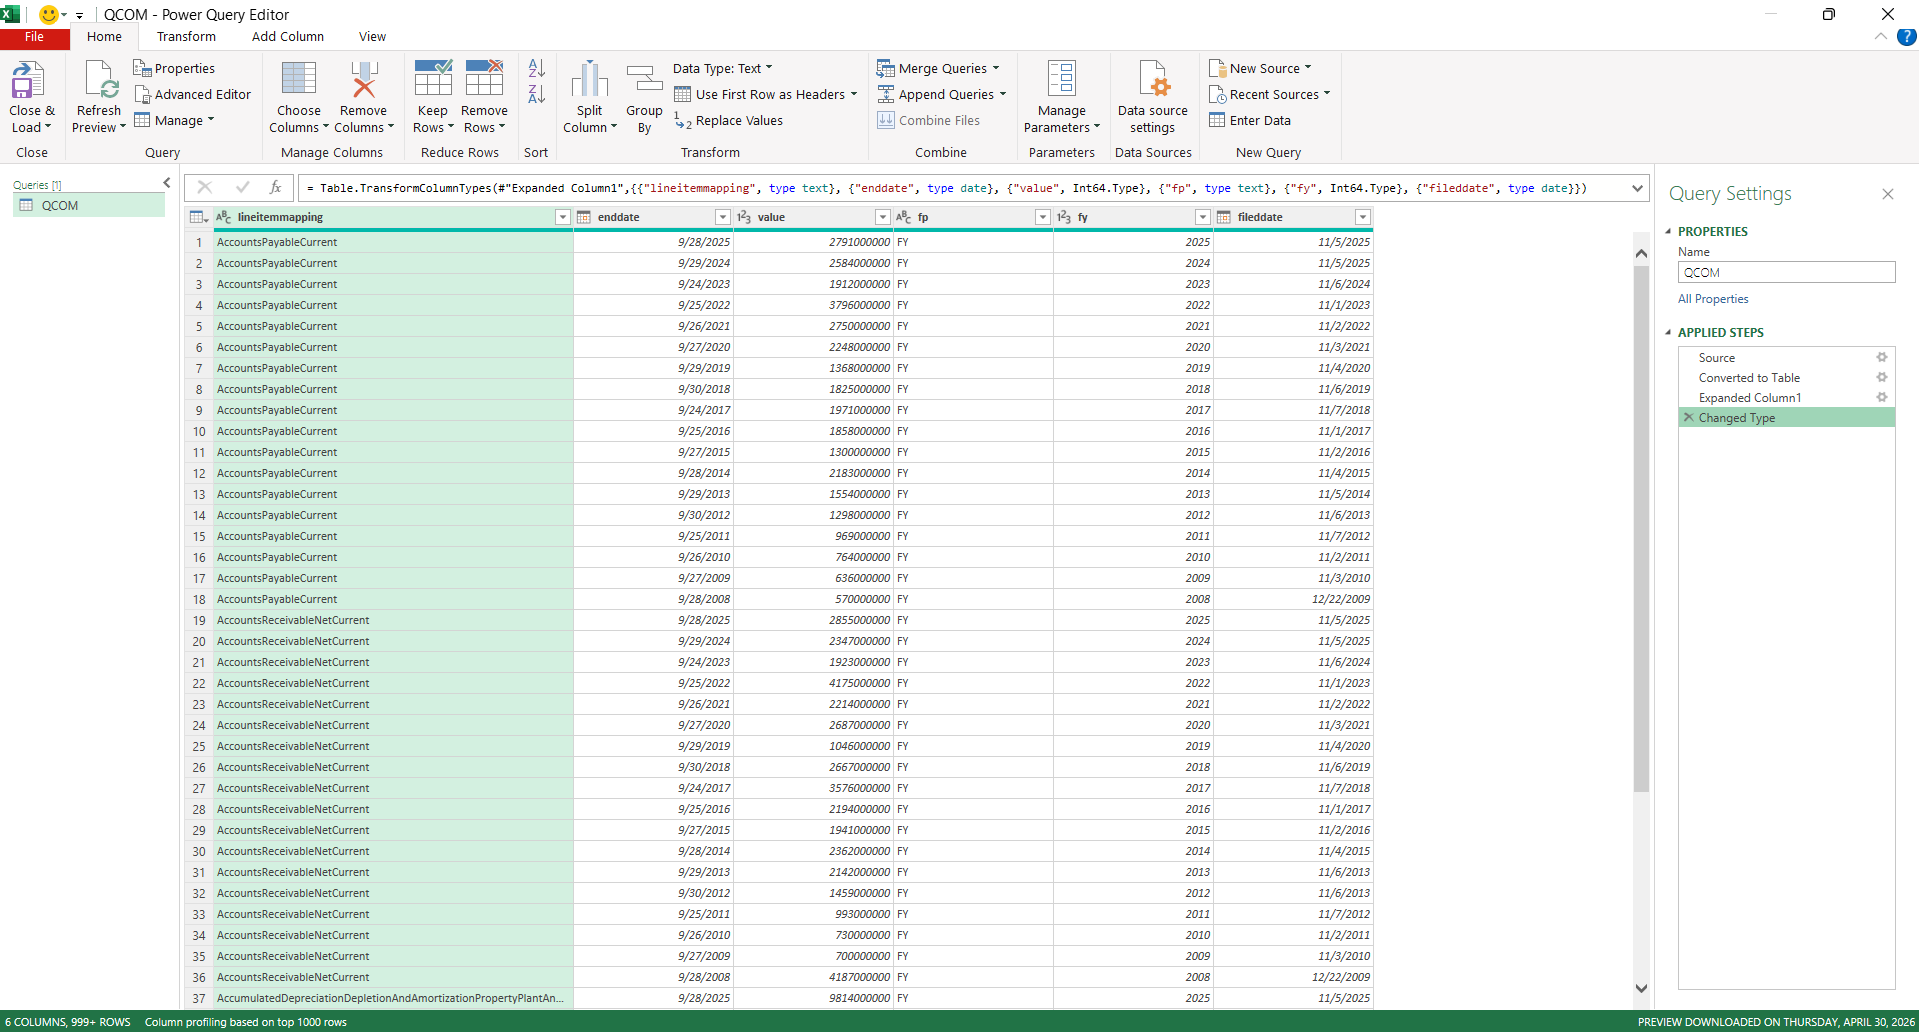
YouDomo pulls directly from SEC EDGAR filings and presents balance sheets, income statements, and cash flows in a format that's fast to read and easy to act on — whether you're a seasoned analyst or just getting started with fundamental investing.
What We Build
Every YouDomo product is built around one goal: making it faster and easier to do the analysis that drives better investment decisions.
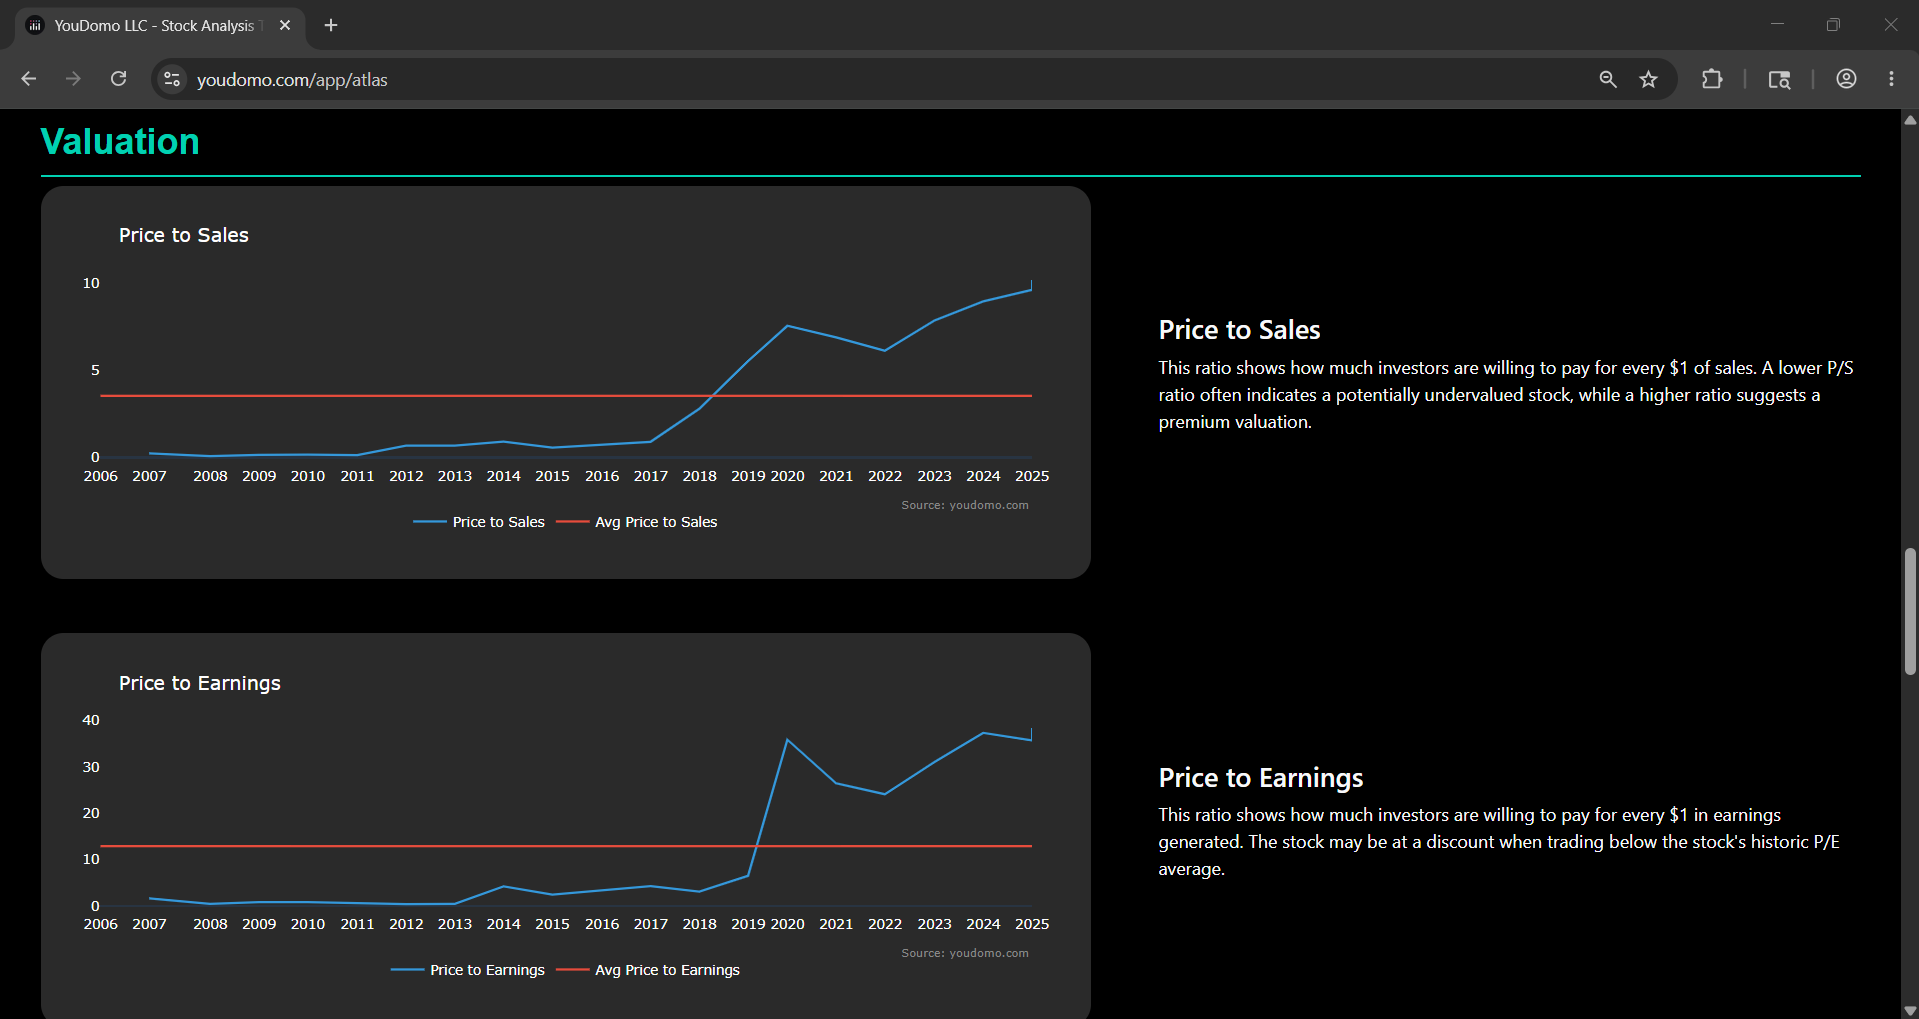
Visualize 10+ years of balance sheets, income statements, cash flows, and valuation multiples for any US-listed stock. See annual and quarterly SEC filings in clean, interactive charts.
Explore Atlas →Filter 3,500+ stocks by revenue growth, profit margins, P/E ratios, debt levels, and 20+ other fundamental metrics. Find companies that match your investment criteria in seconds.
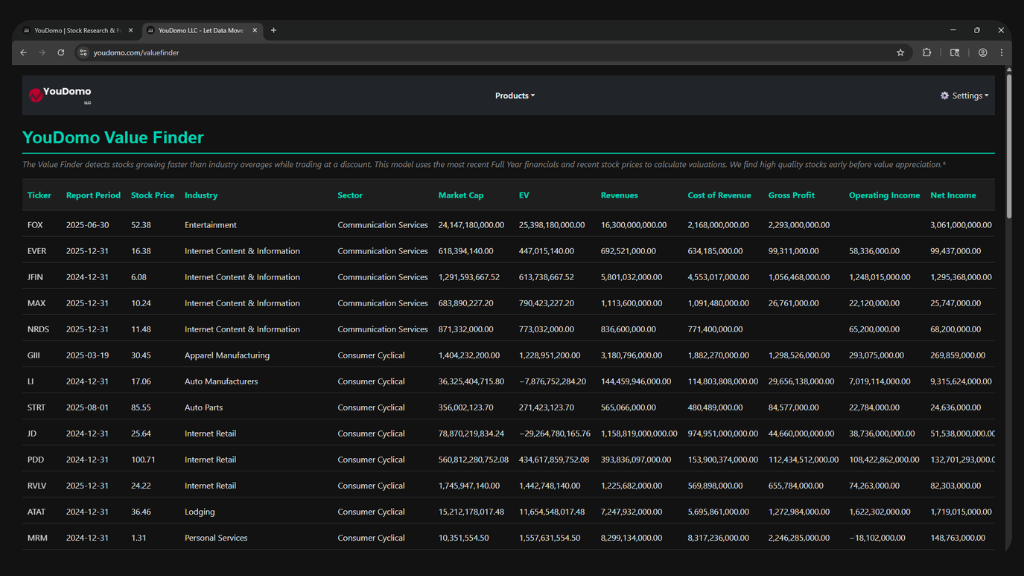
Try the Screener →YouDomo calculates industry-average financial ratios and flags stocks growing faster than peers while trading at a discount. Surface undervalued opportunities automatically.
Find Value →Pull SEC filing data directly into Python via a clean REST API compatible with pandas and NumPy. Or paste the API link into Excel and your financial model populates automatically — no plugins needed.
View API Docs →Machine learning models trained on fundamental and technical data generate probabilistic stock price forecasts with transparent backtested performance metrics.
Explore AI →We put our own tools to work. The YouDomo Fund uses our platform's fundamental analysis to build a real portfolio — and we publish every position publicly so you can follow along.
See Positions →YouDomo's financial statement API gives developers and analysts direct access to 10+ years of SEC-filed income statements, balance sheets, and cash flows. Clean JSON responses that drop straight into pandas DataFrames — or paste the endpoint link directly into Excel and the data populates with no plugins required.
Read the API docs →
Instead of hunting through annual reports, Atlas pulls every 10-K and 10-Q filed with the SEC and plots it into clear, comparable charts. Revenue trends, free cash flow, debt levels, valuation multiples — all on one screen, updated automatically when new filings drop.
Open Atlas →
YouDomo Fund
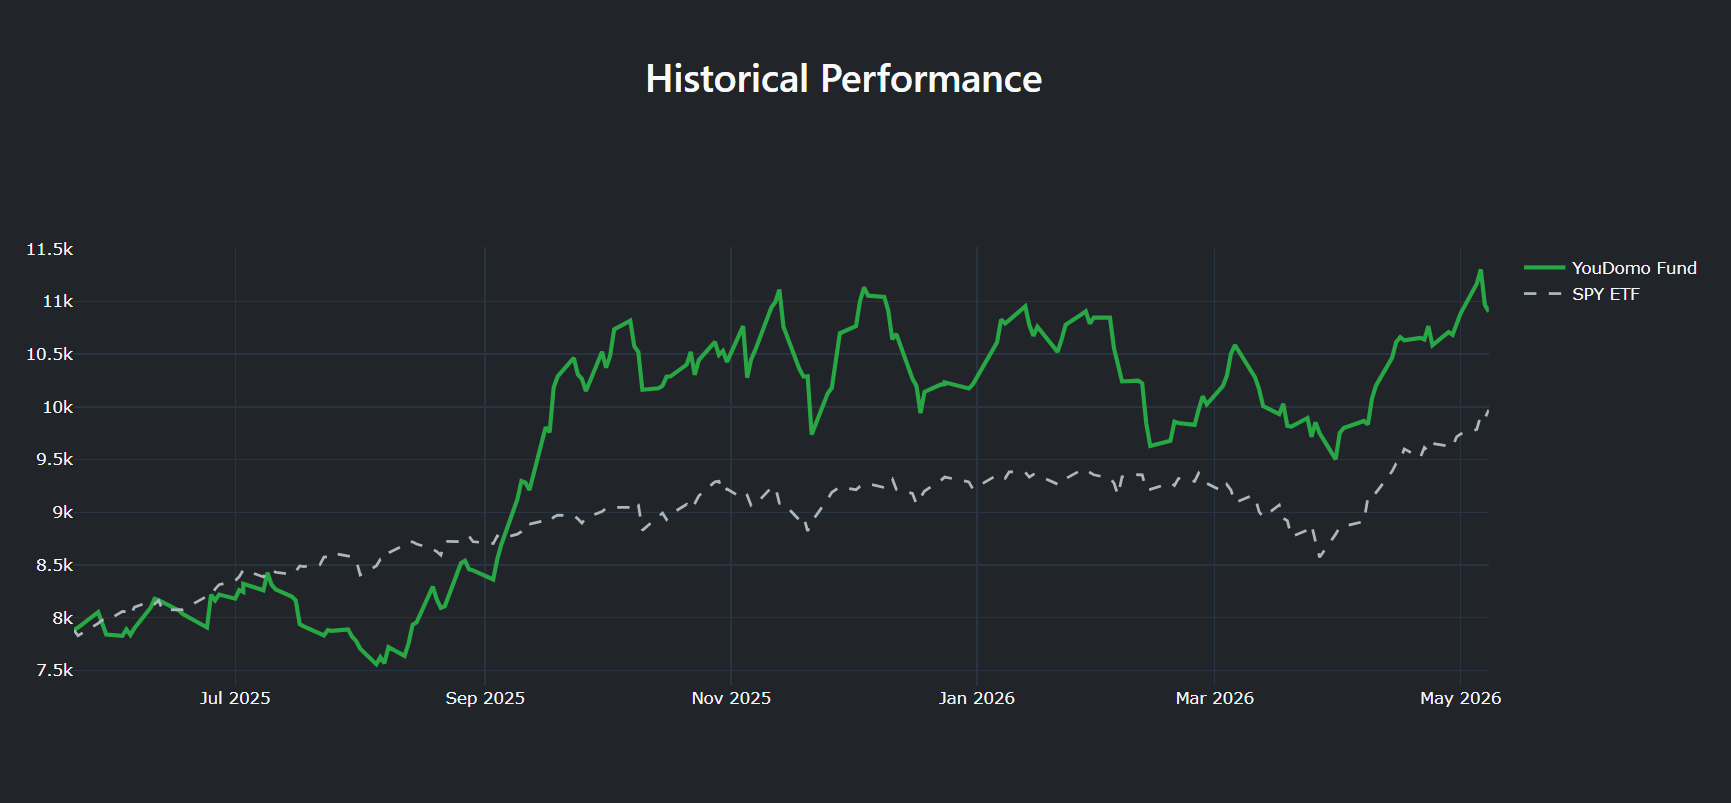
The YouDomo Fund is a real portfolio built entirely using our platform's fundamental analysis tools. We publish every position, entry price, and return publicly. If our tools are good enough to beat the S&P 500, we want you to see it.
* Between May 16, 2025 and May 08, 2026. Past performance does not guarantee future results. Not financial advice.
See all positions →
Who We Serve
Whether you're picking individual stocks on the weekend or building quantitative models professionally, YouDomo has a tool for your workflow.
Get institutional-quality financial data without paying institutional prices. Research any stock the way Wall Street analysts do — from your laptop.
Integrate clean SEC financial data into your models via REST API. Works natively with pandas. Build backtests, screeners, and DCF models without wrestling with raw XBRL data.
Learn fundamental analysis with real company data. Build DCF models, practice ratio analysis, and understand how to read financial statements using live SEC filings.
Screen opportunities, monitor holdings, and generate Excel-ready financial summaries across your watchlist — without expensive Bloomberg or FactSet subscriptions.
Why YouDomo
Every number comes straight from official SEC EDGAR filings — the same source used by institutional investors. No third-party data vendors, no black-box adjustments.
Raw numbers don't tell stories. YouDomo transforms 10-K and 10-Q filings into interactive charts that make trends, growth rates, and red flags immediately visible.
Core features are free with no credit card required. We believe every investor deserves access to quality financial data — not just those who can afford terminal subscriptions.
Analyze in the browser, pull data into Python via API, or populate Excel models with a single link. YouDomo fits into your existing workflow instead of replacing it.
Free to start. No credit card required. 3,500+ stocks ready to analyze.