Between May 16, 2025 and May 08, 2026
YouDomo gives individual investors financial visibility that Wall Street professionals rely on - without the six-figure data subscriptions.
Our Mission
Professional investors have always had an edge: access to clean, structured financial data that makes it easy to evaluate a company's true health. We built YouDomo to close that gap.
YouDomo pulls directly from SEC filings and presents balance sheets, income statements, and cash flows in a format that's fast to read and easy to act on - whether you're a seasoned analyst or just getting started with fundamental investing.
What We Do
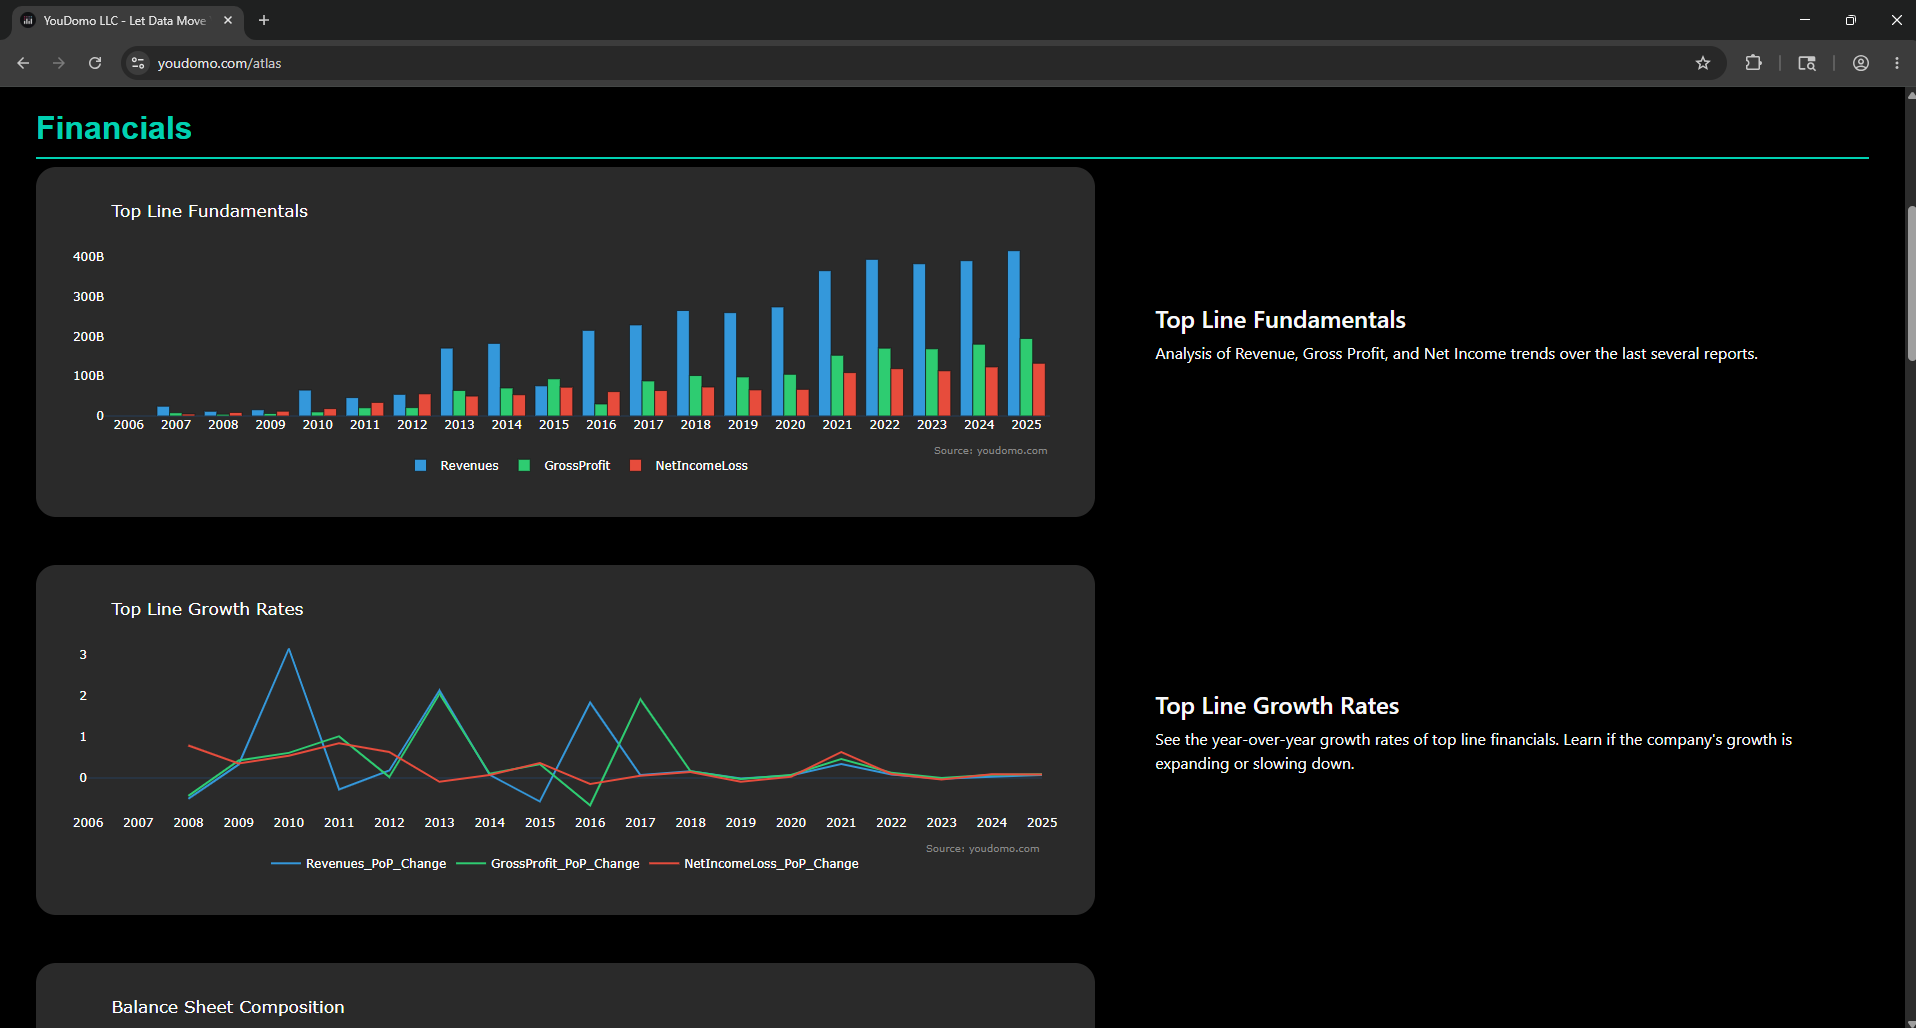
View 10+ years of balance sheets, income statements, and cash flows in clean, interactive charts. Spot trends in seconds instead of hours.
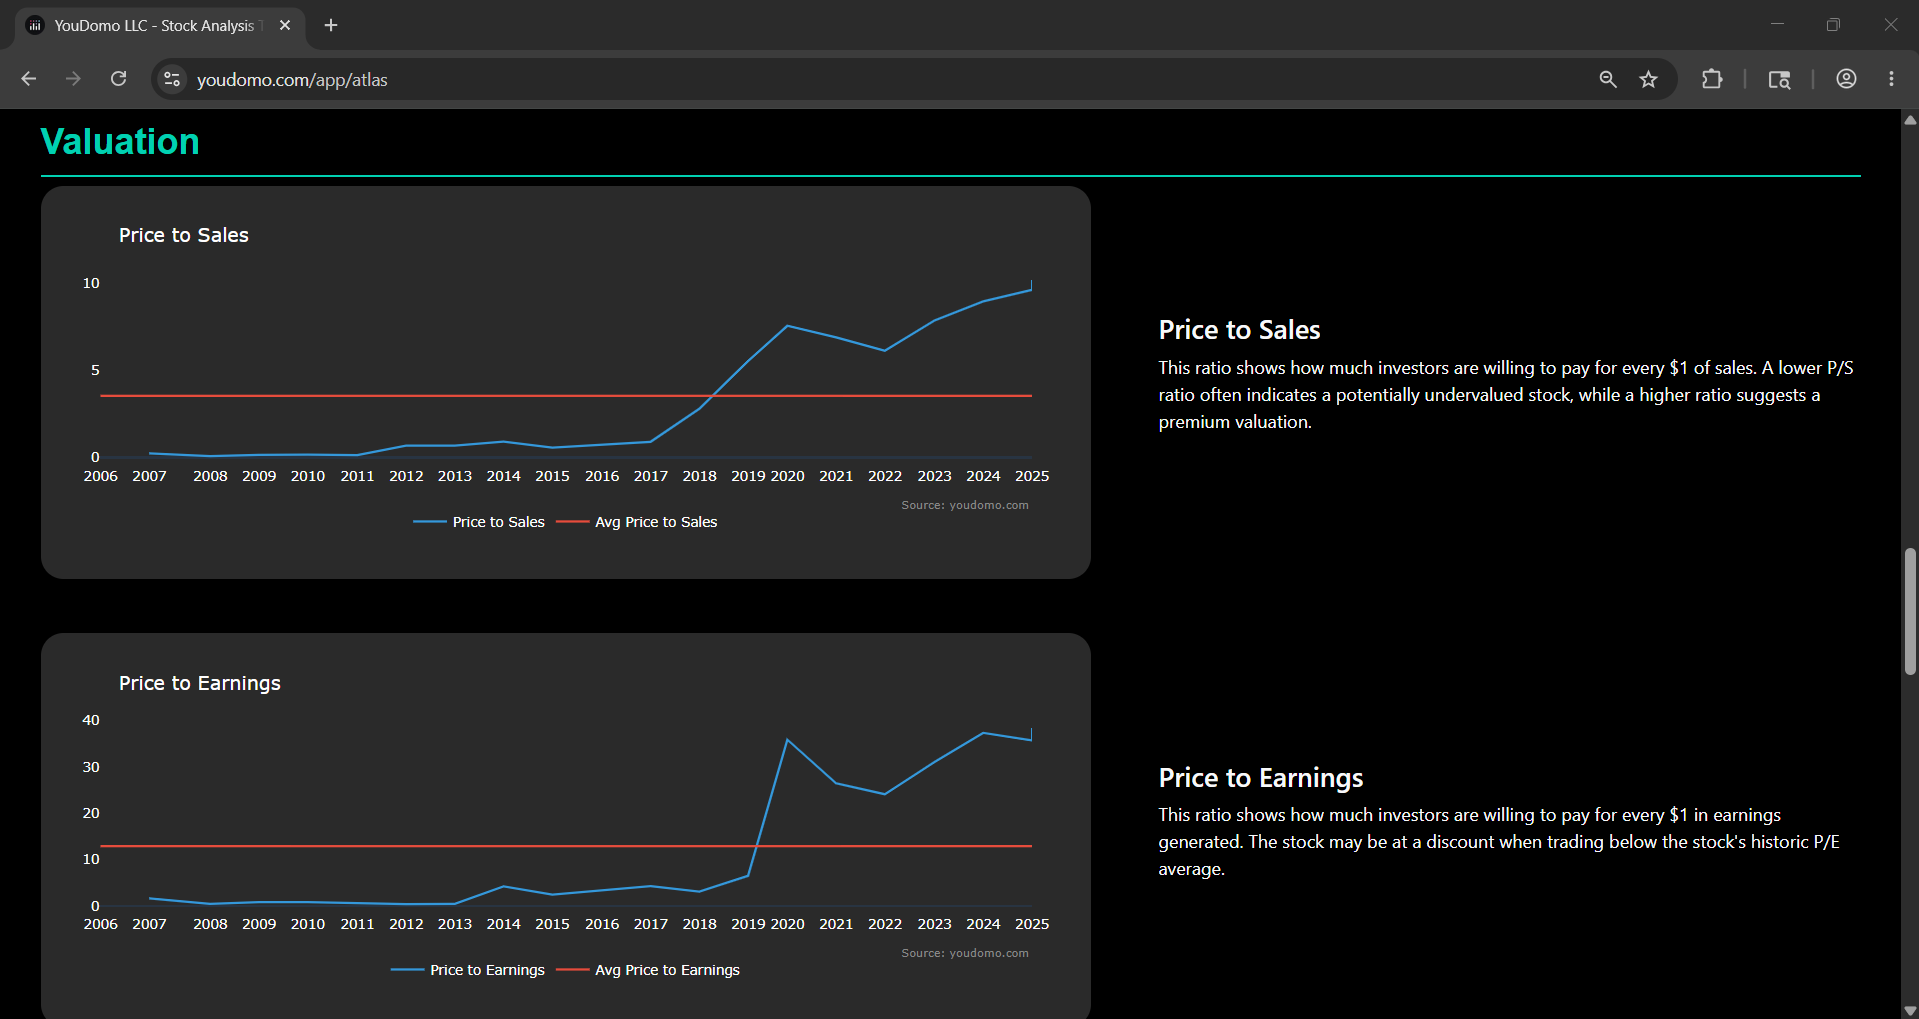
Track P/E, P/S, P/FCF, and more - plotted historically so you can see whether a stock is cheap or expensive relative to its own history.
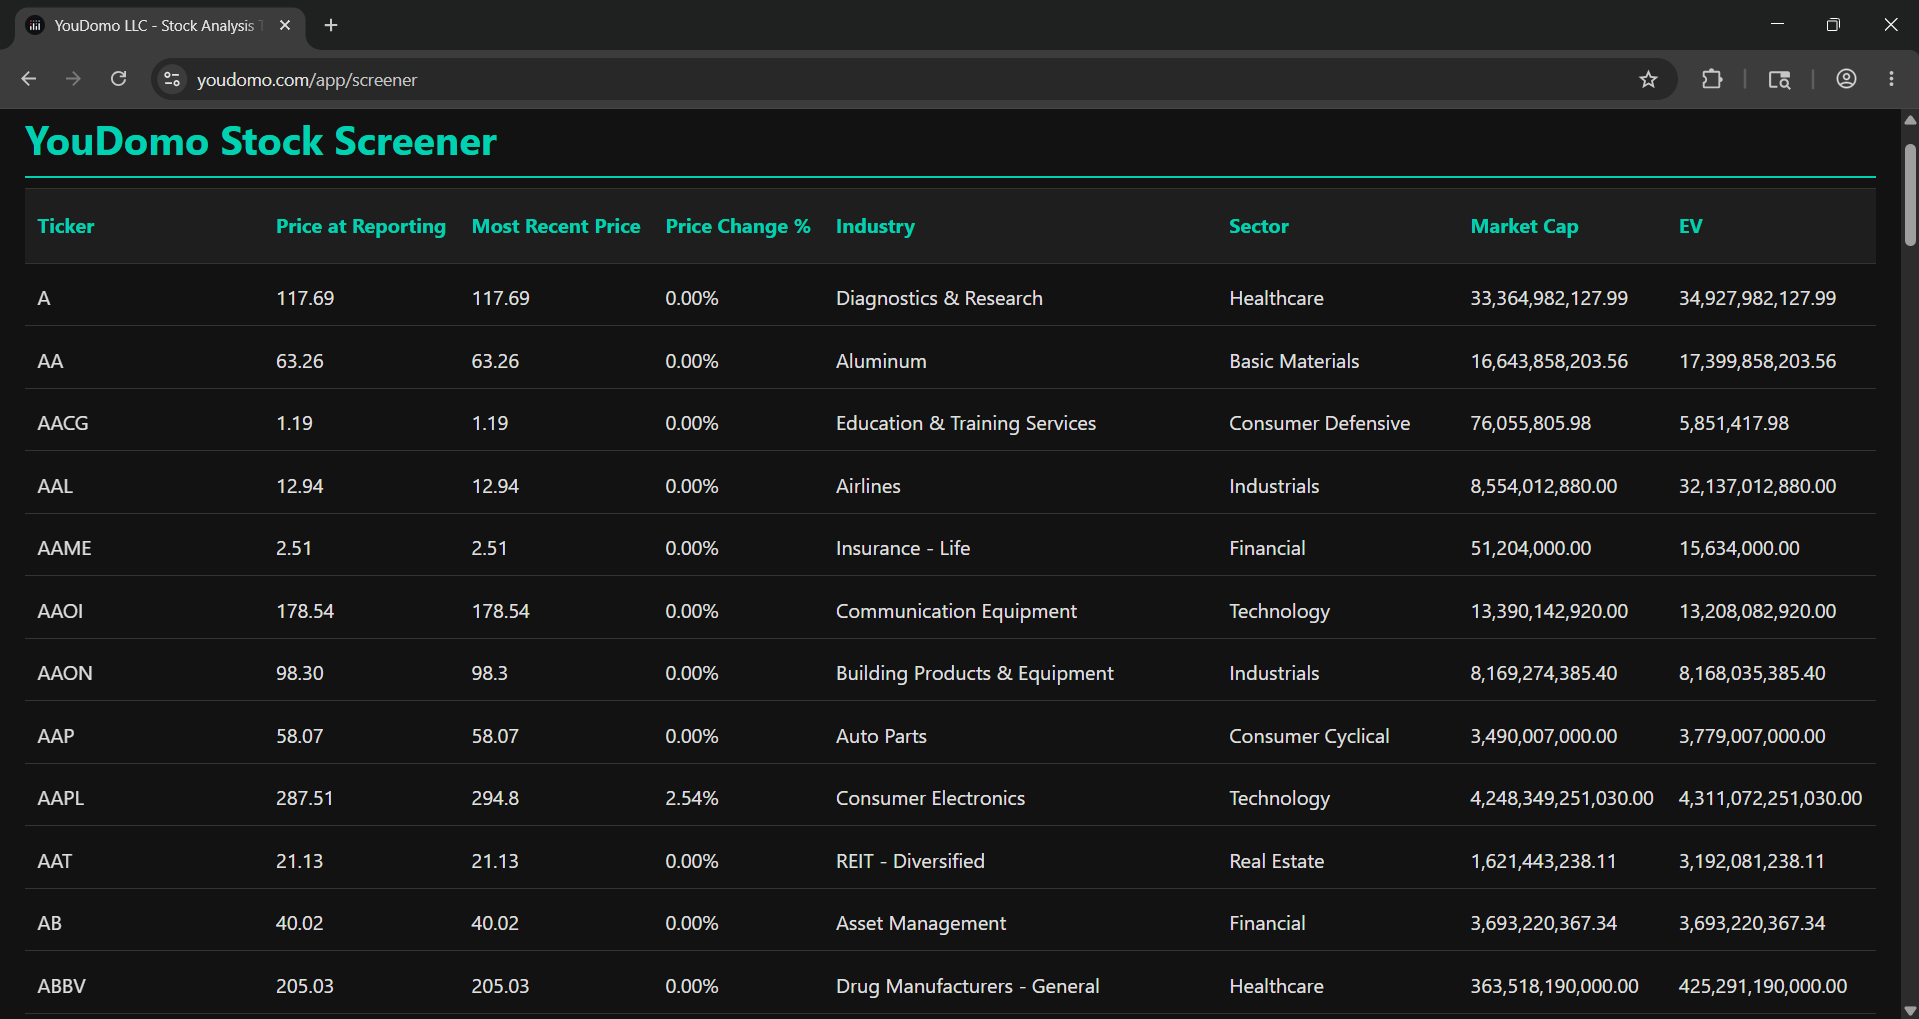
Filter 3,500+ stocks by revenue growth, profit margins, debt ratios, and valuation multiples. Find companies that fit your unique fundamental criteria.
Machine learning models trained on fundamental and technical data deliver probabilistic price forecasts with transparent backtested performance.
Integrate SEC filing data directly into your Python workflows. Clean JSON responses compatible with pandas and NumPy out of the box.
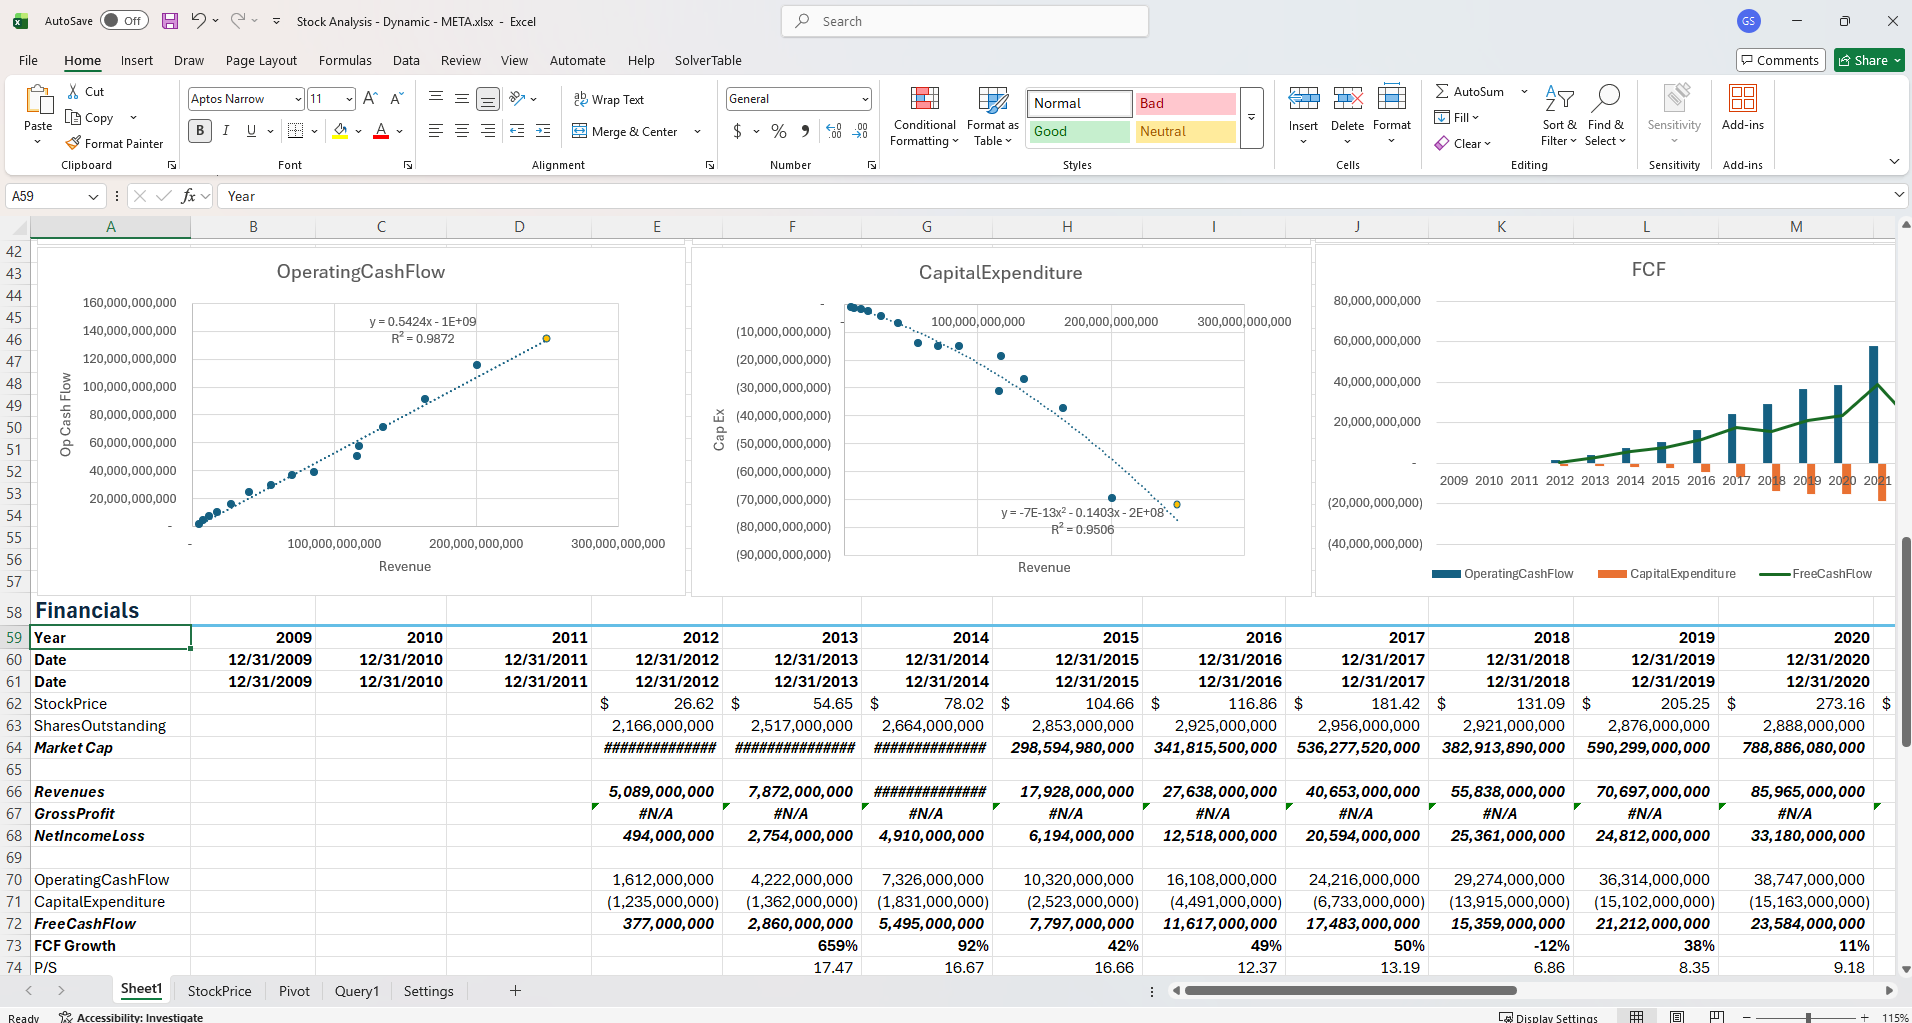
Pull a company's full financial history into Excel using our financial API. No plugins, no add-ins - just a link and your data is ready to model.
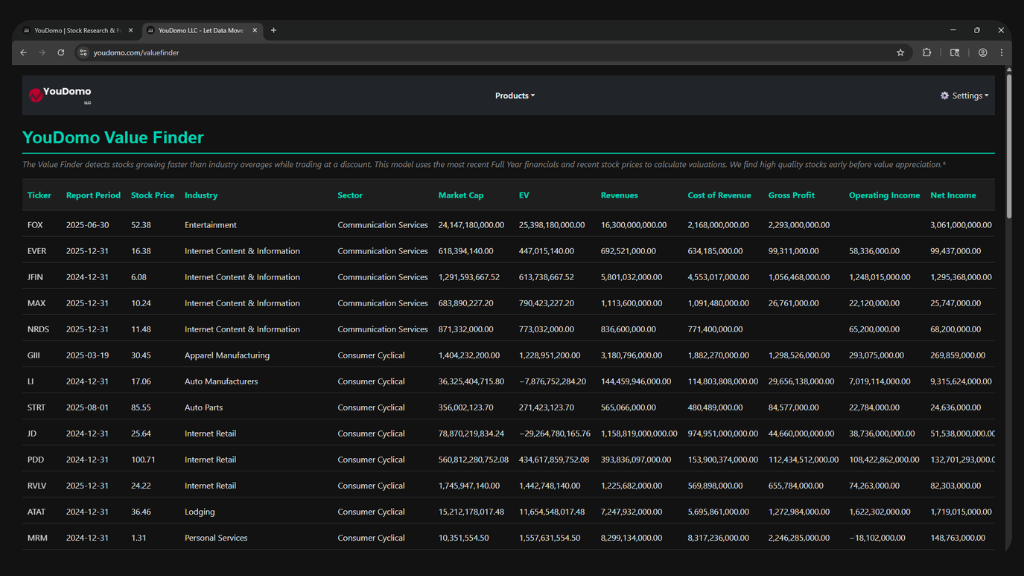
Our Value Finder calculates industry-average financial ratios and compares each stock against its peers. Stocks with superior growth trading at a discount get surfaced automatically - no spreadsheet required.
Try it free →* YouDomo is not financial advice. Models can make mistakes.
Search over 3,500 US-listed tickers and instantly see its complete financial history: revenue trends, free cash flow, debt levels, and valuation multiples - all on one screen with zero setup.
Explore the terminal →
The YouDomo Atlas calulates popular financial valuation multiples like price-to-sales and price-to-free cash flow to see if stocks are trading at relative discount - automating your stock analysis.
Try it free →
Filter through over 3,500 US-listed tickers and instantly see stocks that match your criteria. Discover which stocks are trading below industry average price-to-sales valuations, filter for stocks with free cash flow growth greater than 10%, find stocks with positive price-to-earnings.
Explore the terminal →
Automate your stock analysis with our financial API to easily get financial statement data, from revenue to capital expenditure, directly into Excel and Python using our simple JSON API.
Try it free →
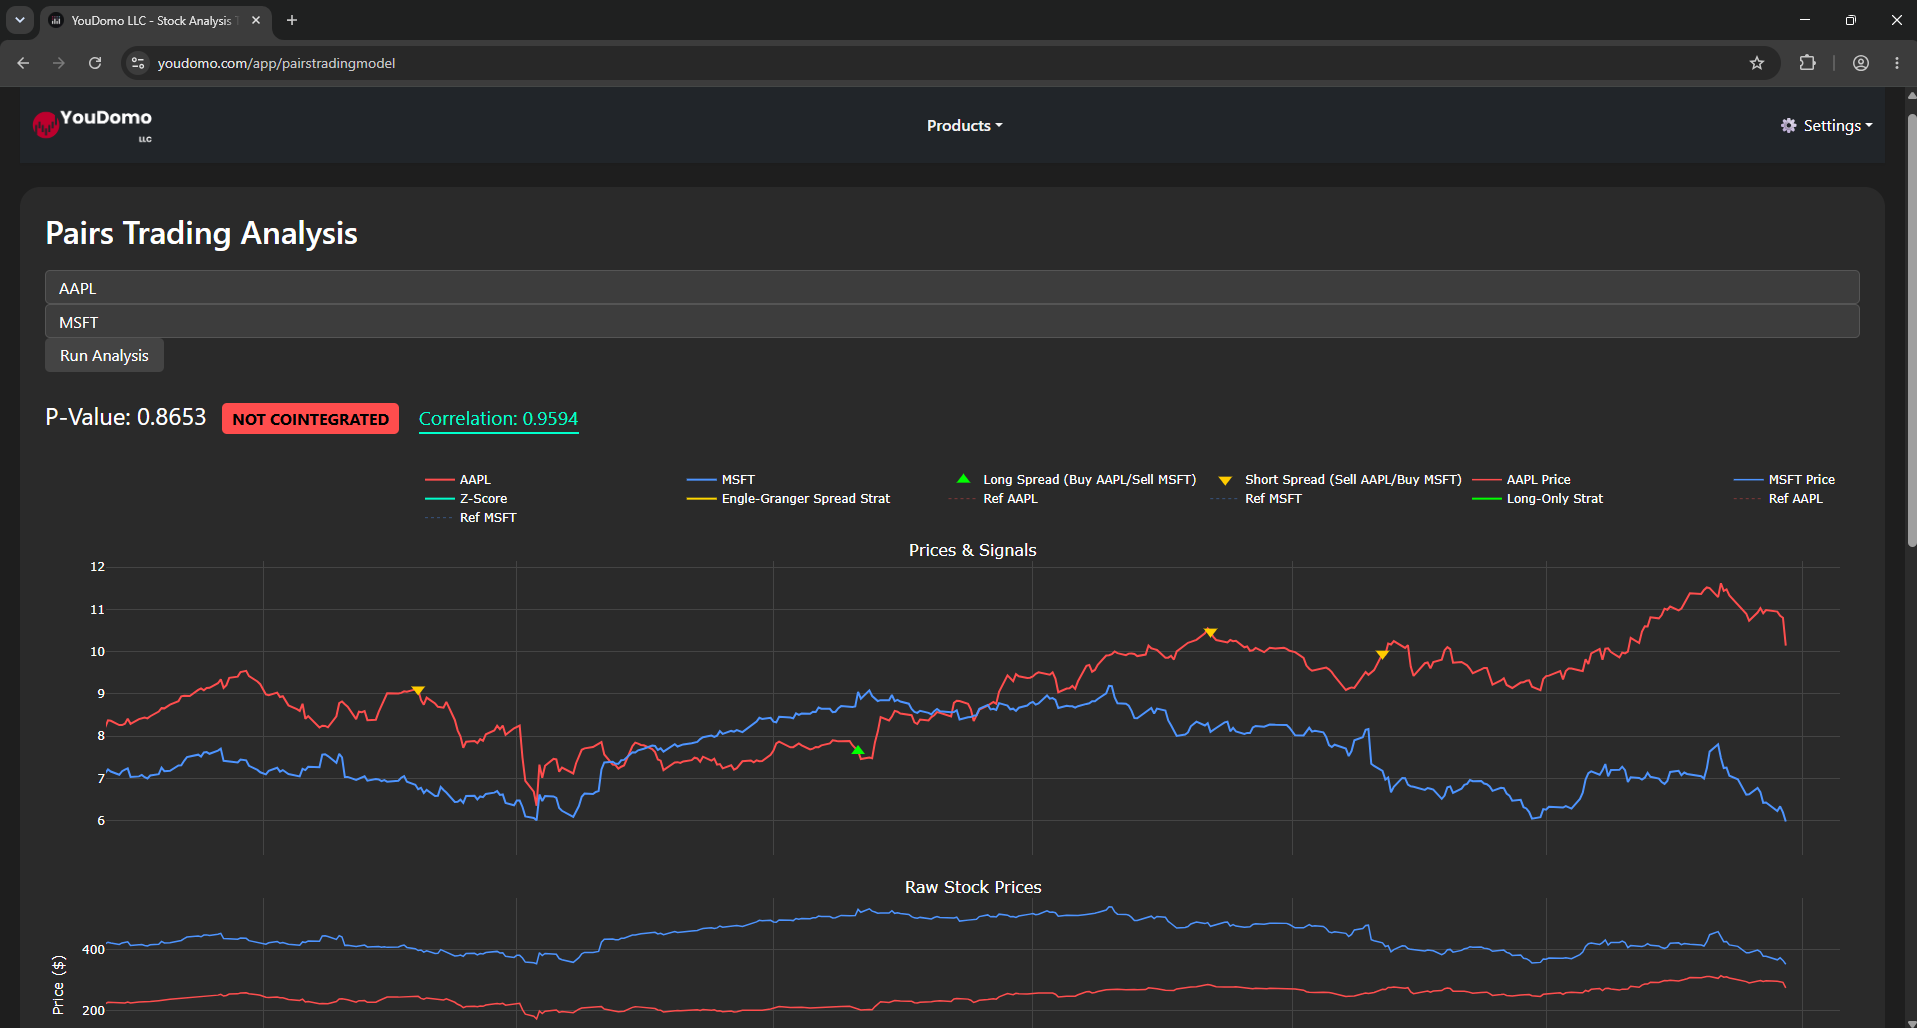
Statistically backed buy and sell signals between two stocks based on Z-Score spread. See historic Spread and Long-Only strategies for confidence in each trade.*
Explore the terminal →* YouDomo is not financial advice. Models can make mistakes.
Who We Serve
Get institutional-quality financial data without paying institutional prices. Research stocks the way the pros do.
Integrate clean SEC financial data into your models via REST API. Works natively with pandas and your existing data pipeline.
Learn fundamental analysis with real data. Build DCF models, screen for value stocks, and practice the frameworks used on Wall Street.
Monitor holdings, screen for opportunities, and generate Excel-ready financial summaries without expensive data subscriptions.
Free to start. No credit card required. 3,500+ stocks ready to analyze.