🧪 Quant Research LabPro

Is This Stock's Valuation Actually Correlated
with Better Returns?

Domo Lab is where fundamental analysis meets machine learning. Pick from over 20 valuation multiples and financial line items, choose a forward return window, and YouDomo automatically fits a linear and polynomial regression model to tell you whether cheap valuations have historically led to stronger stock returns — and what the current price implies going forward.

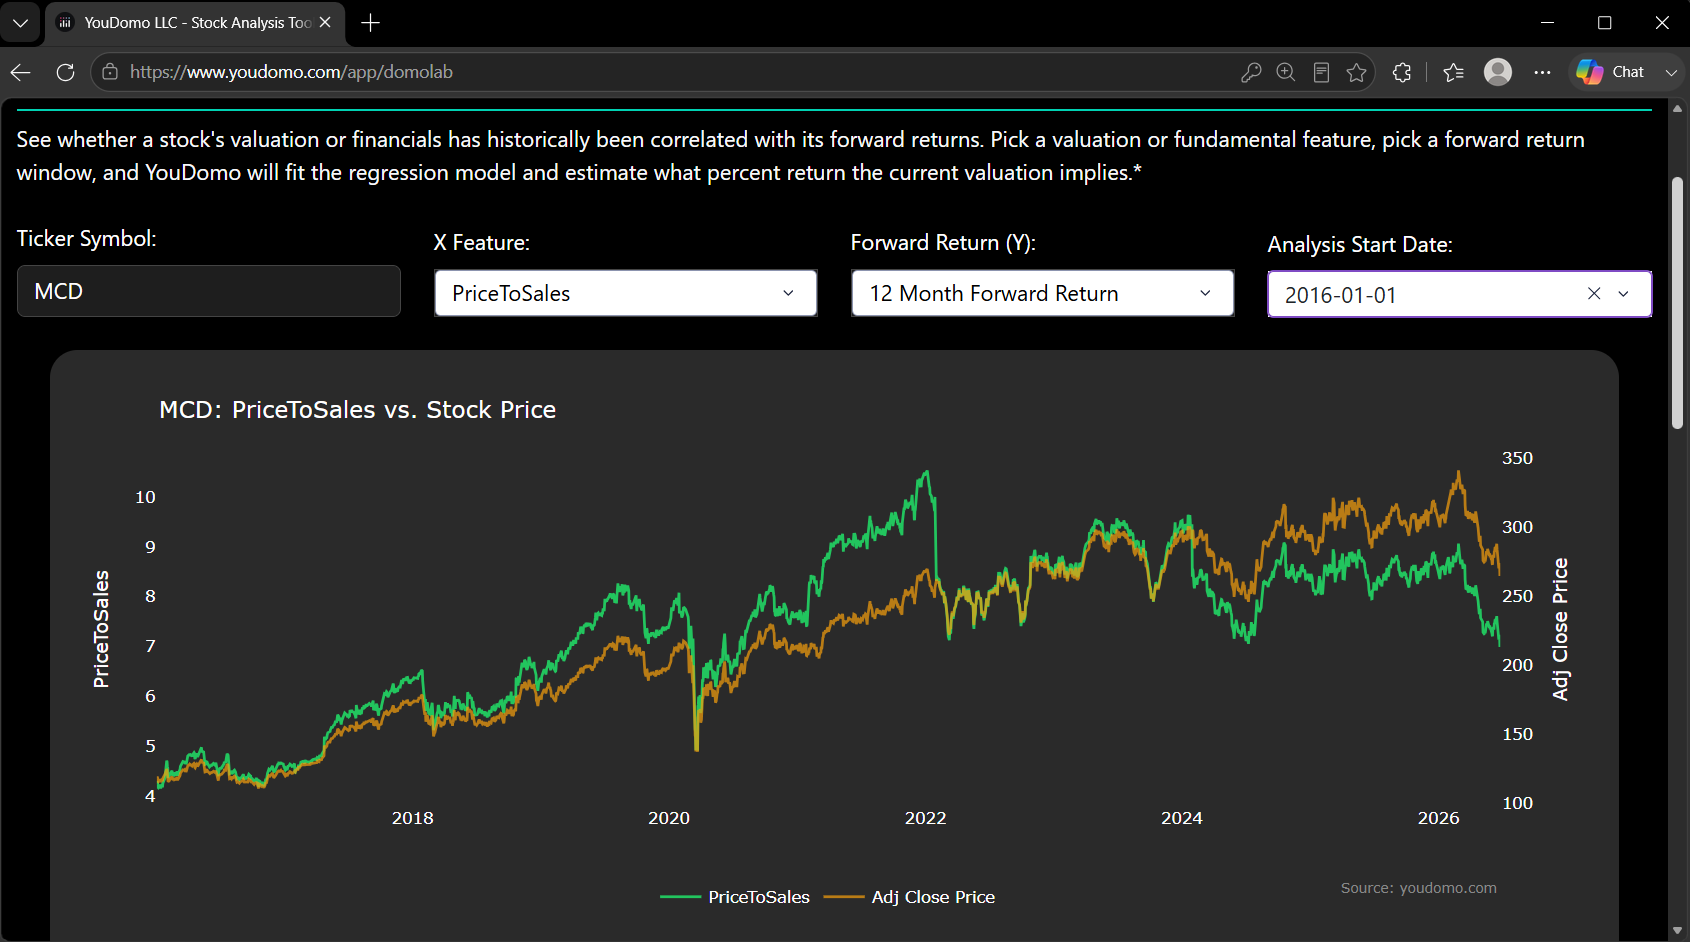
Domo Lab dual-axis chart comparing MCD PriceToSales valuation multiple against McDonald's stock price over time
20+ Valuation & Fundamental Features
2 Regression Models Compared
5 Forward Return Windows
10+ Years of Backtested History

Features

A Quant-Grade Correlation Engine for Stock Valuation Analysis

Domo Lab automatically tests whether valuation ratios like price-to-sales, price-to-earnings, and price-to-free-cash-flow, or fundamentals like revenue growth and margins, have any statistical relationship with a stock's forward returns — then fits the best-performing regression model to the data.

📉

Valuation vs. Forward Return Scatter Plots

Plot popular valuation multiples against 1, 3, 6, 12 or 60 month forward stock returns to visually spot whether cheap or expensive valuations have historically preceded stronger performance.

🤖

Automated Linear & Polynomial Regression

YouDomo fits both a linear and 2nd-degree polynomial regression model to the data and automatically selects the winning model based on R² lift, so you don't have to run the statistics yourself.

📐

Correlation & R² Model Selection Report

Every analysis returns a full model selection report: sample size, correlation coefficient, linear R², polynomial R², the fitted equation, and mean absolute error — true quant analytics, not a black box.

🎯

Implied Forward Return Estimate

Domo Lab plots the stock's current valuation on the fitted regression curve and estimates what forward return the historical relationship implies at today's price.

📅

Custom Analysis Start Date

Narrow the regression to a specific historical period — exclude the 2020–2021 valuation distortion, isolate a rate-hiking cycle, or focus only on the last five years of data.

🔬

Fundamentals & Financial Line Items, Not Just Multiples

Test revenue growth, margins, free cash flow, and other financial statement line items against forward returns — not limited to valuation ratios alone.
Time Series View

See How a Stock's Valuation Multiple
Has Tracked Its Price Over Time

Start every Domo Lab analysis with a dual-axis time series chart overlaying the selected valuation multiple against the stock's adjusted close price, going back over a decade. Instantly see whether the stock is trading rich or cheap relative to its own history before diving into the regression.

Run your first regression →
MCD PriceToSales versus stock price dual axis line chart in Domo Lab

Regression & Model Selection

Let the Data Tell You
Which Model Actually Fits

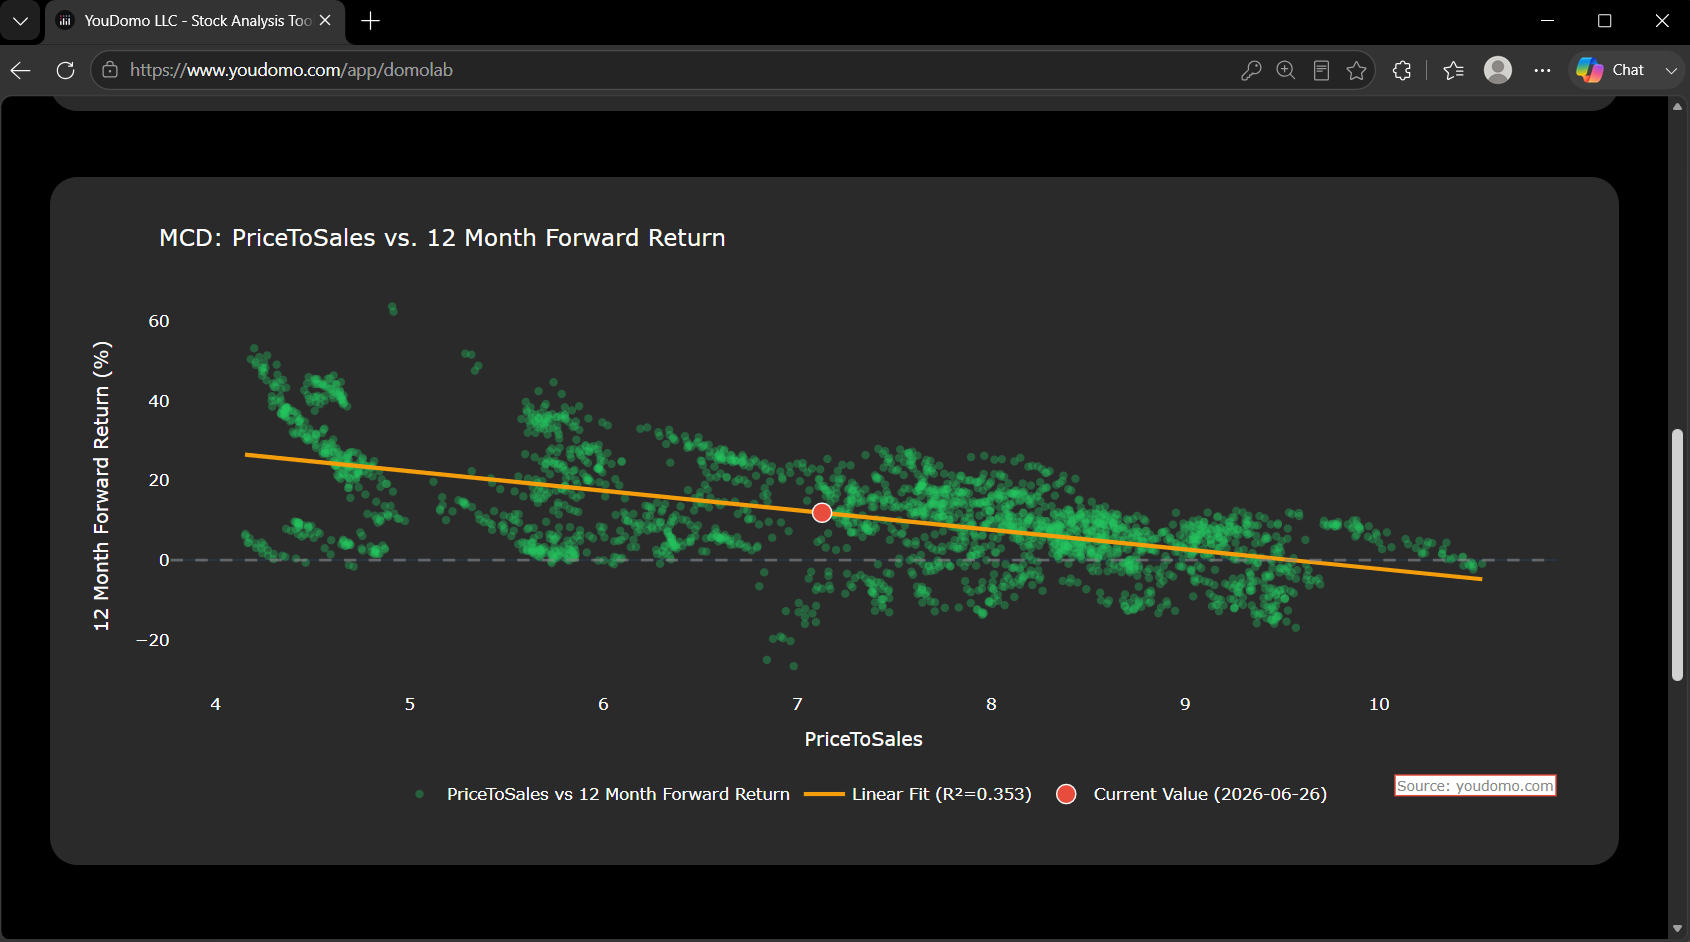
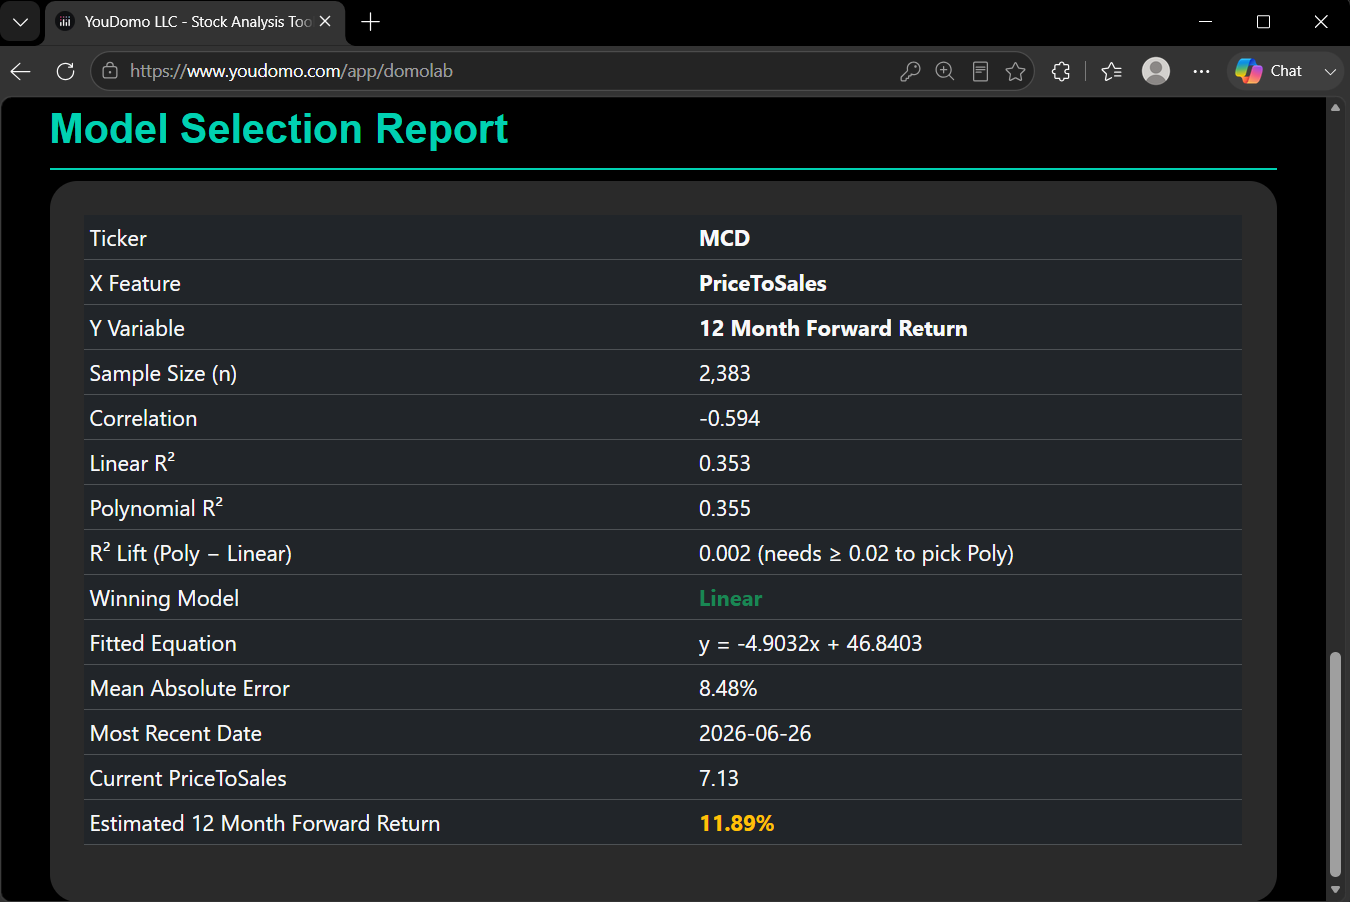
Domo Lab plots every historical valuation-to-return observation as a scatter, overlays the best-fit curve, and marks the stock's current value directly on the line. The Model Selection Report shows the exact fitted equation, R² lift threshold used to pick the winning model, mean absolute error, and the implied forward return — full transparency into the quant methodology.

See the full model report →
Domo Lab scatter plot of PriceToSales versus 12 month forward return with polynomial regression fit and model selection report table

From Ticker to Correlation Analysis in 3 Steps

01

Pick a ticker and a feature

Enter a stock symbol and choose a valuation multiple or fundamental line item — price-to-sales, price-to-earnings, revenue growth, margins, and more.

02

Choose a forward return window

Select a 1, 3, 6, 12 or 60 month forward return period, and optionally set a custom start date to focus the analysis on a specific market regime.

03

Let YouDomo fit the model

Domo Lab fits linear and polynomial regression models, selects the best fit, and reports the correlation, R², and implied forward return at the stock's current valuation.


Under the Hood

The Statistics Behind Every Domo Lab Report

Domo Lab isn't a black box. Every analysis surfaces the same statistical outputs a quant analyst would compute by hand — just automated.

Correlation Coefficient

Measures the strength and direction of the linear relationship between the chosen feature and forward returns.

Linear vs. Polynomial R²

Compares how much of the variance in forward returns is explained by a straight-line fit versus a curved, 2nd-degree polynomial fit.

R² Lift & Winning Model

The polynomial model is only selected over the simpler linear model when it clears a minimum R² improvement threshold, avoiding overfitting.

Fitted Equation

The exact regression equation used to generate the estimate, so you can see precisely how the implied return was calculated.

Mean Absolute Error

Quantifies, on average, how far actual historical forward returns have deviated from what the fitted model predicted.

Implied Forward Return

Plugs the stock's current valuation into the winning model to estimate the forward return the historical relationship implies today.


FAQ

Common Questions About Domo Lab

Domo Lab tests whether a stock's valuation multiple or a financial line item has historically been correlated with its forward stock returns. You pick a feature and a forward return window, and YouDomo fits linear and polynomial regression models to the historical relationship, then reports the correlation, R², fitted equation, and what the current valuation implies for future returns.
Free users can explore Domo Lab using AAPL. YouDomo Pro members can run the full regression and correlation analysis on any supported ticker across all valuation multiples and fundamental features.
YouDomo fits both a linear and a 2nd-degree polynomial regression to the historical data. The polynomial model is only selected as the winning model if its R² improvement over the linear fit clears a minimum lift threshold, which helps avoid overfitting a curve to noisy data.
Domo Lab currently supports 1, 3, 6, and 12 month forward return windows, so you can see whether a valuation or fundamental feature is more predictive over shorter or longer holding periods.
No. Domo Lab, and all material from YouDomo, is a research and analysis tool. Historical correlation between a valuation multiple and forward returns does not guarantee future performance. All data and results are for informational purposes only and do not constitute investment advice or a recommendation to buy or sell any security. Always do your own due diligence.

Test Your Valuation Thesis With Real Regression Analysis

Stop eyeballing valuation charts and guessing. Let Domo Lab run the statistics and tell you what the data actually says.

Upgrade to Pro → Try Domo Lab Free

Other YouDomo Tools