Visualize Financial Statements Faster with YouDomo Atlas
Search 3,500+ US-listed stocks and see top line fundamentals like revenue and net income, along with free cash flow, popular valuation multiples like price to earnings and price to sales, visualize balance sheets — in seconds.
Everything You Need to Visualize Financial Statements
YouDomo Atlas easily visualizes financial data from SEC filings - a new, clean way to visualize financial statements.
📊
Valuation Multiples
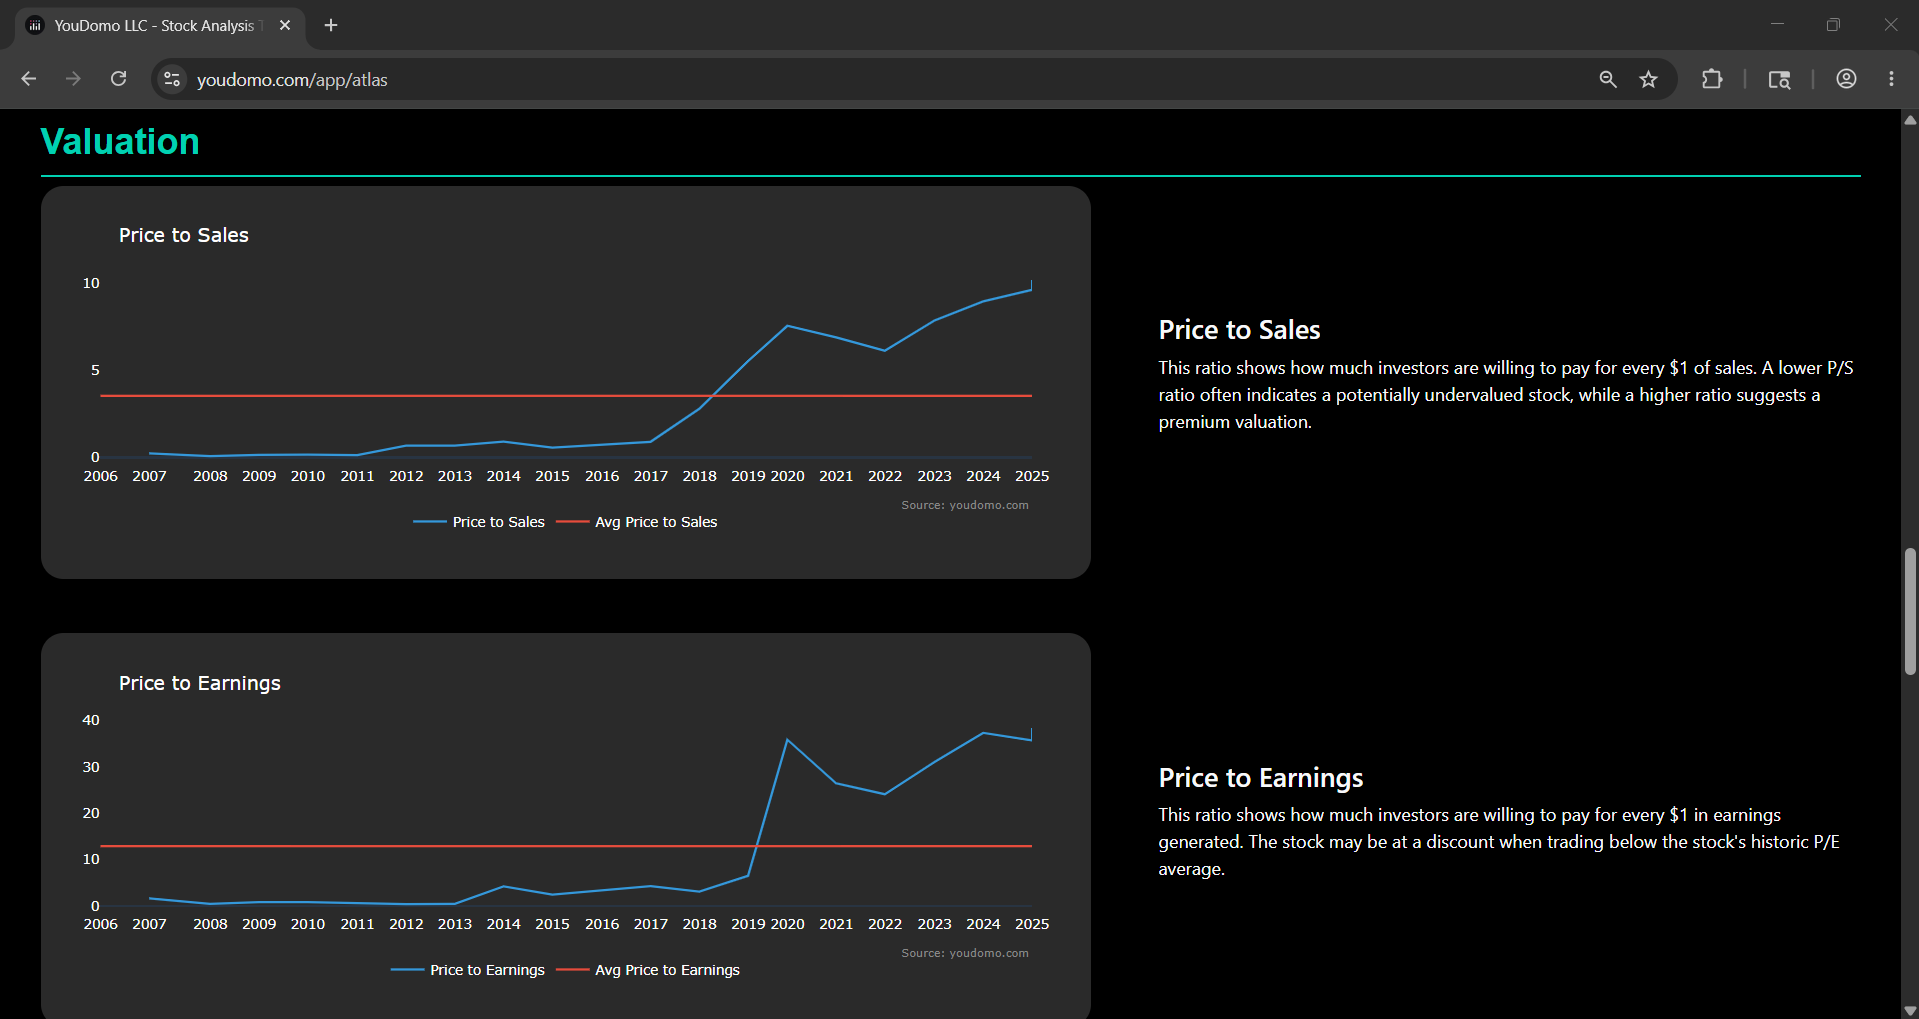
See historic valuation ratios like price to free cash flow and price to earnings and discover if a stock is trading at a relative discount.
📈
Revenue & Earnings Growth
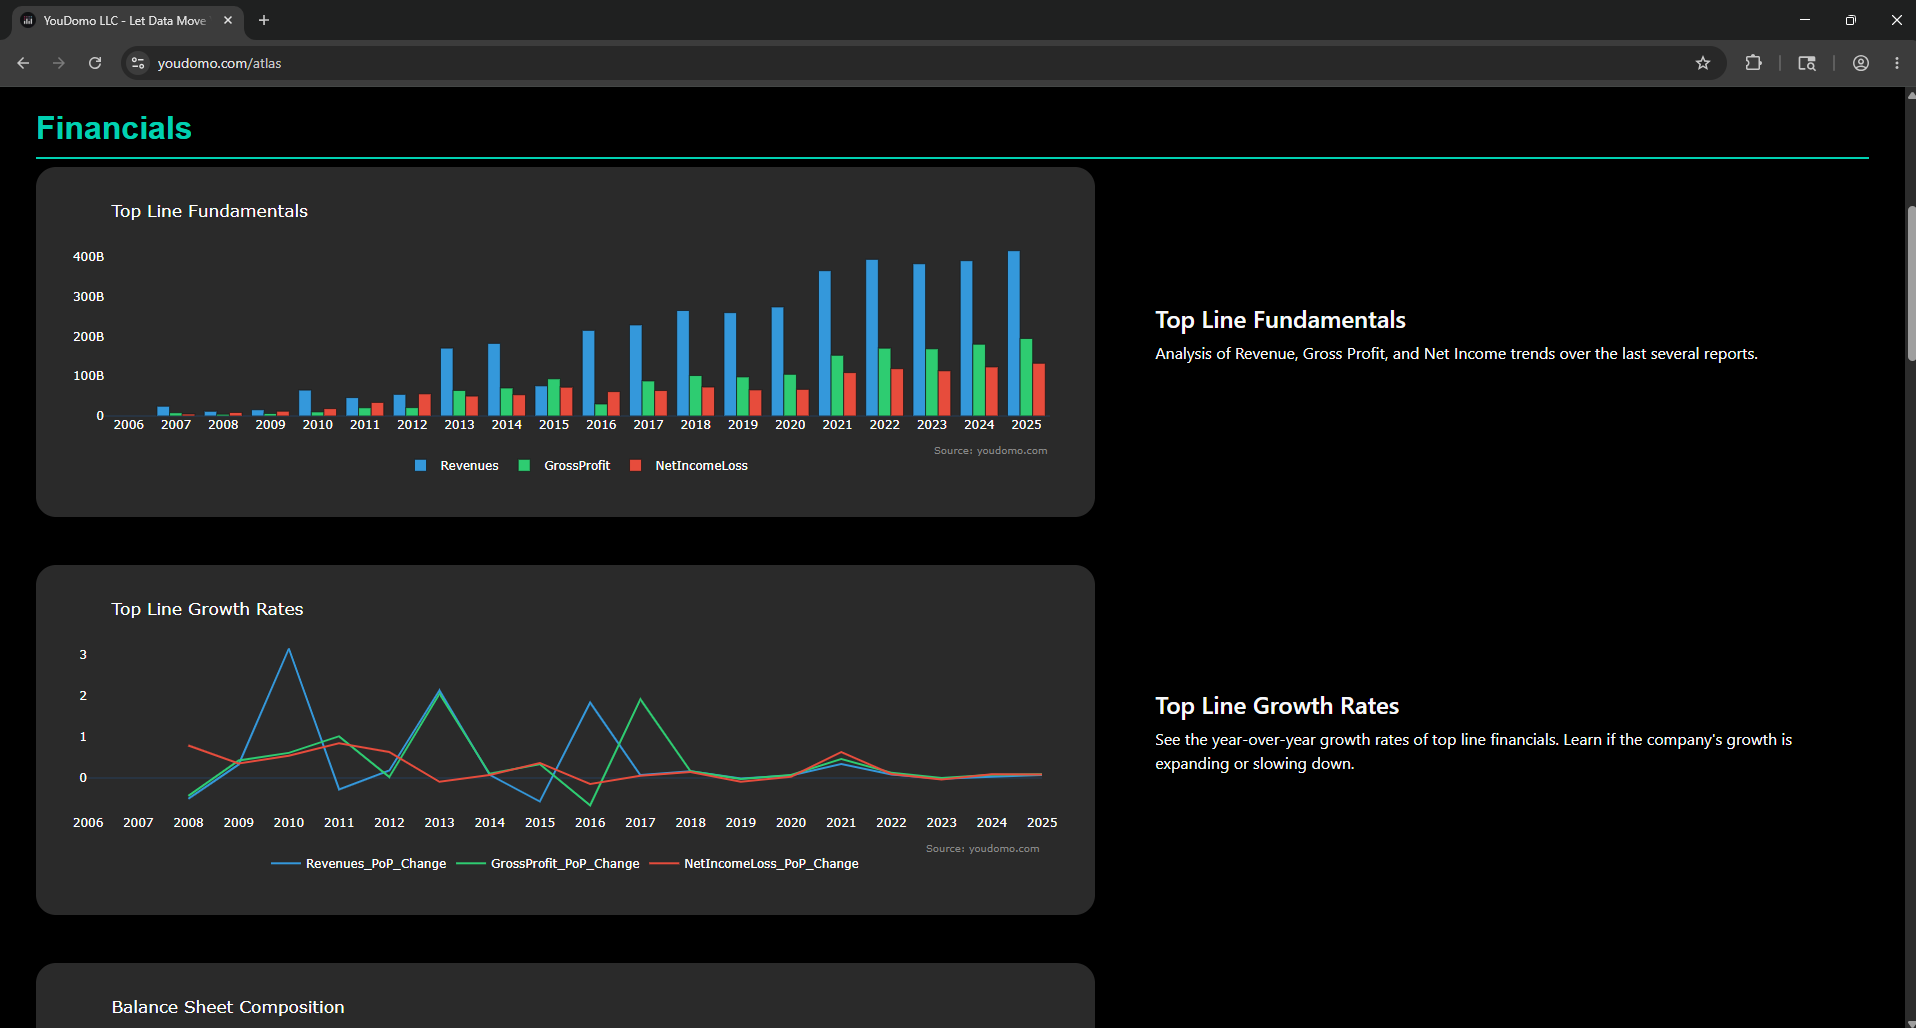
Visualize top line fundamentals and growth rates for revenue and net income.
💰
Free Cash Flow
Easily see operating cash flow versus capital expenditure - discover how much free cash flow companies generate.
🏦
Balance Sheet Health
Analyze cash and debt on the balance sheet along with debt to equity to see which companies are over-leveraged.
🏭
Industry Comparisons
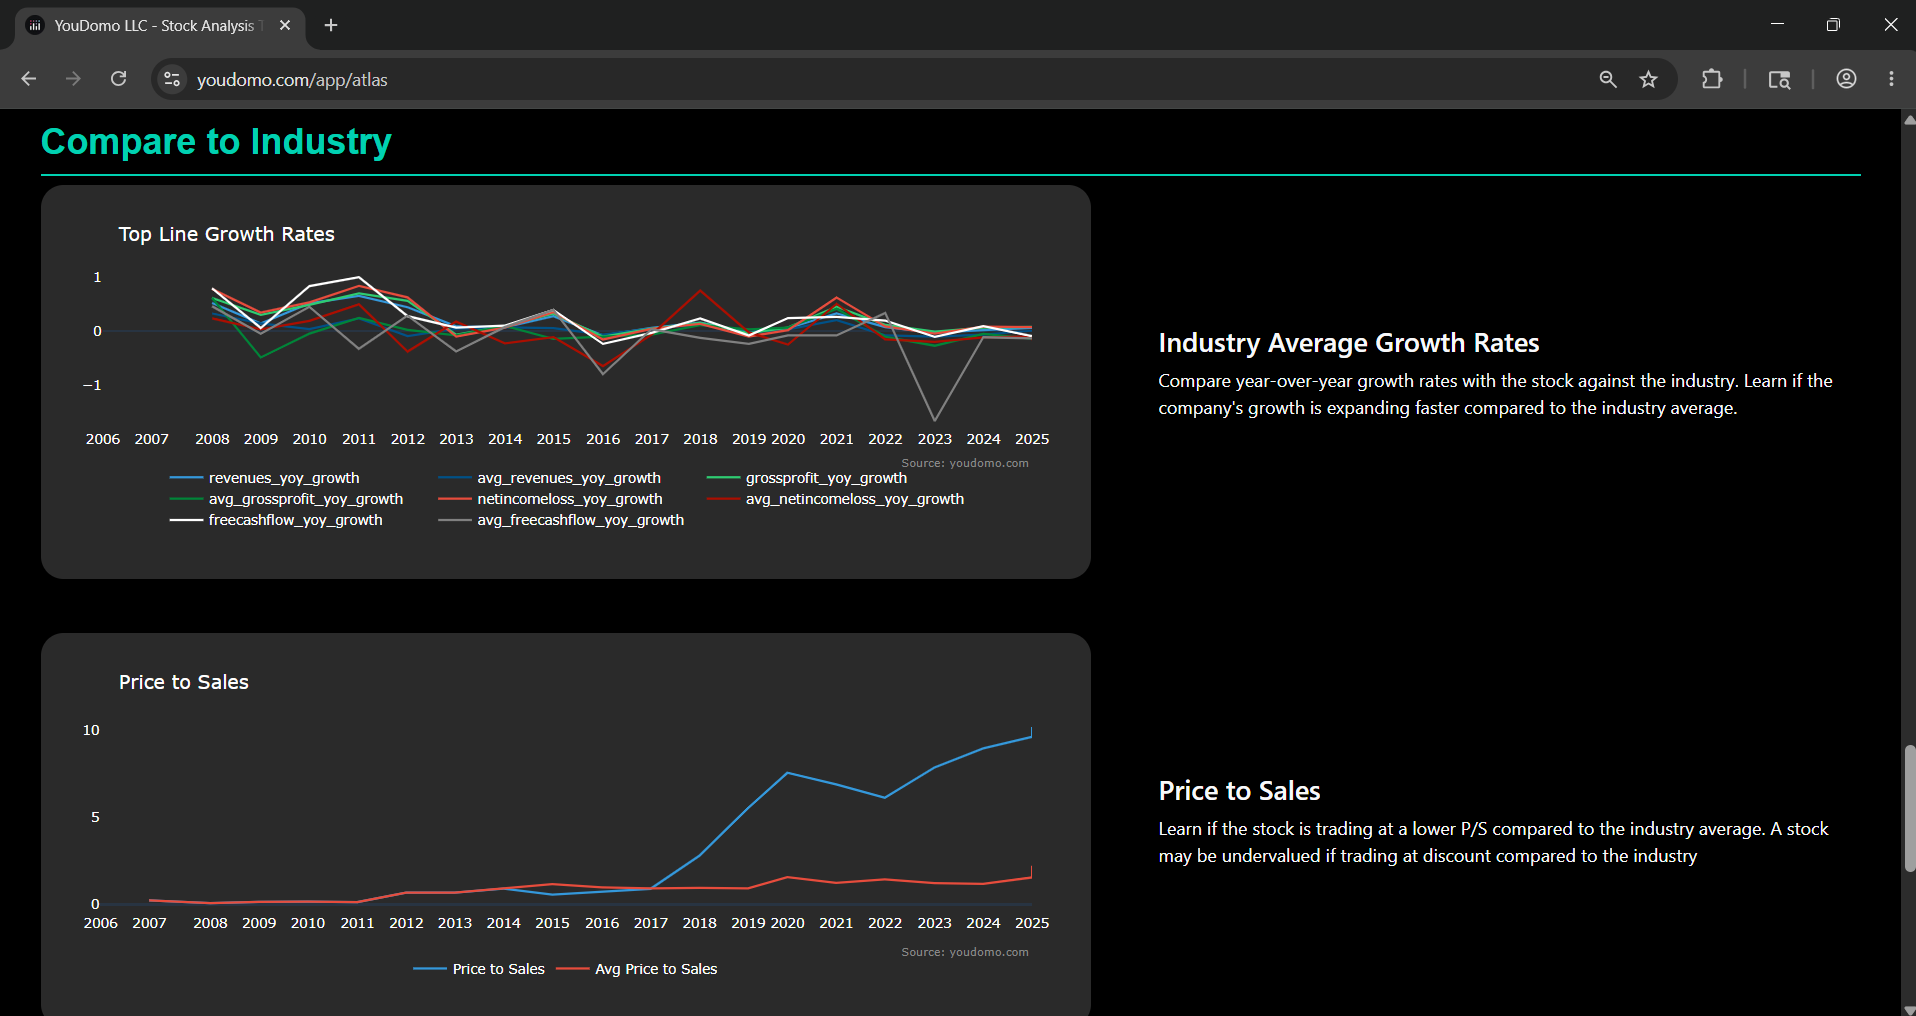
Instantly compare the stock's valuation multiples against their respective industries - analyze whether the stock is trading at a discount compared to competitors.
📥
Custom Chart Builder
Customize and build your own charts to find patterns in the fundamentals.
Screening
Tired of Backtracking 10-Ks? Let Atlas Pull Historic Data.
Search a stock and YouDomo Atlas automatically pulls 10+ years worth of annual and quarterly reports
Atlas automatically calculates and compares the stock's financial growth rates and multiples against the respective sector. Easily compare the stock's price to sales compares to the industry average.
Enter a stock ticker you want to visualize financial statements.
02
Select Annual or Quarterly
Atlas supports annual 10-k and quarterly 10-q reports.
03
Visualize
Explore data-rich charts and see the company's top line growth rates, free cash flow, balance sheet, and valuation ratios all in one place.
FAQ
Common Questions About Atlas
Atlas covers 3,500+ US-listed stocks pulling directly from SEC EDGAR filings. The database is updated regularly to reflect the latest quarterly and annual reports.
Yes - free users can access Atlas for annual figures and limited historic data. Pro users unlock quarterly data and all historic financial data YouDomo has for the stock.
All financial data is sourced directly from SEC EDGAR filings - the same official source used by institutional investors. YouDomo normalizes and formats this data for comparable analysis across 3,500+ stocks.
No. Atlas, and all material from YouDomo, is a research and analysis tool. All data and results are for informational purposes only and do not constitute investment advice or a recommendation to buy or sell any security. Always do your own due diligence.
Start Searching Stocks Smarter Today
Free to start. No credit card required. 3,500+ stocks ready to filter.