META is down roughly 12% year-to-date while the S&P 500 (SPY) is up about 8%. Zoom out to a full year and the gap widens further: META is down 18% while SPY is up 24%. The underperformance looks even starker against the Nasdaq-100 (QQQ), which is up 36% over the past year, largely thanks to AI chip and data center exposure.
So what's actually wrong with META stock right now? In short: investors are nervous about the size of the capital expenditure META is pledging to AI infrastructure — and whether it will pay off fast enough.
Why Is META Stock Down in 2026?
META has lagged both the broader market and its AI-adjacent peers, and the reason comes down almost entirely to spending. Free cash flow is taking a real hit in the short term, and free cash flow is exactly the metric investors watch most closely — it's what's left over after operations that can actually be returned to shareholders through buybacks and dividends. When that number compresses, the market tends to react before it sees the payoff.
META's AI CapEx Guidance: $125-145 Billion
In its Q4 2025 report, META said it expected 2026 capital expenditures "to be in the range of $115-135 billion, with year-over-year growth driven by increased investment to support our Meta Superintelligence Labs efforts and core business." That guidance was raised again in the Q1 2026 report, this time to $125-145 billion.
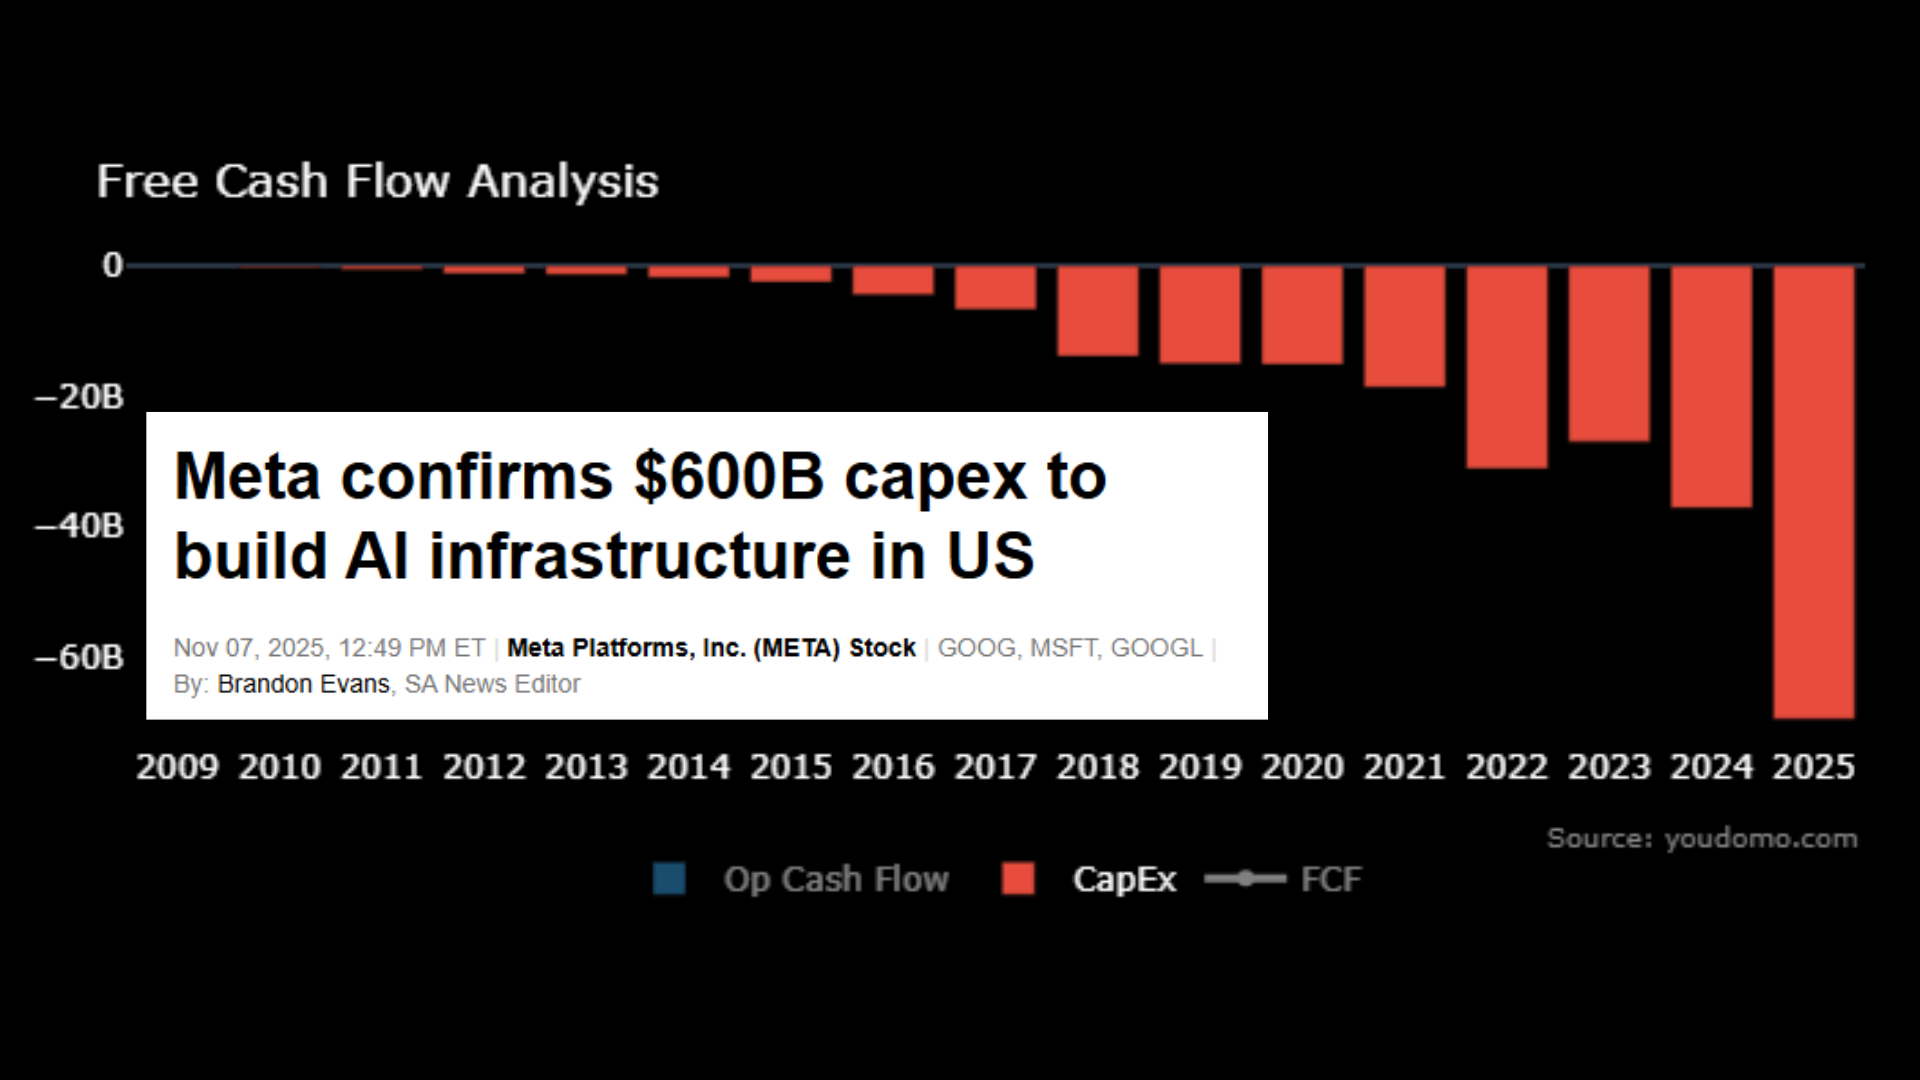
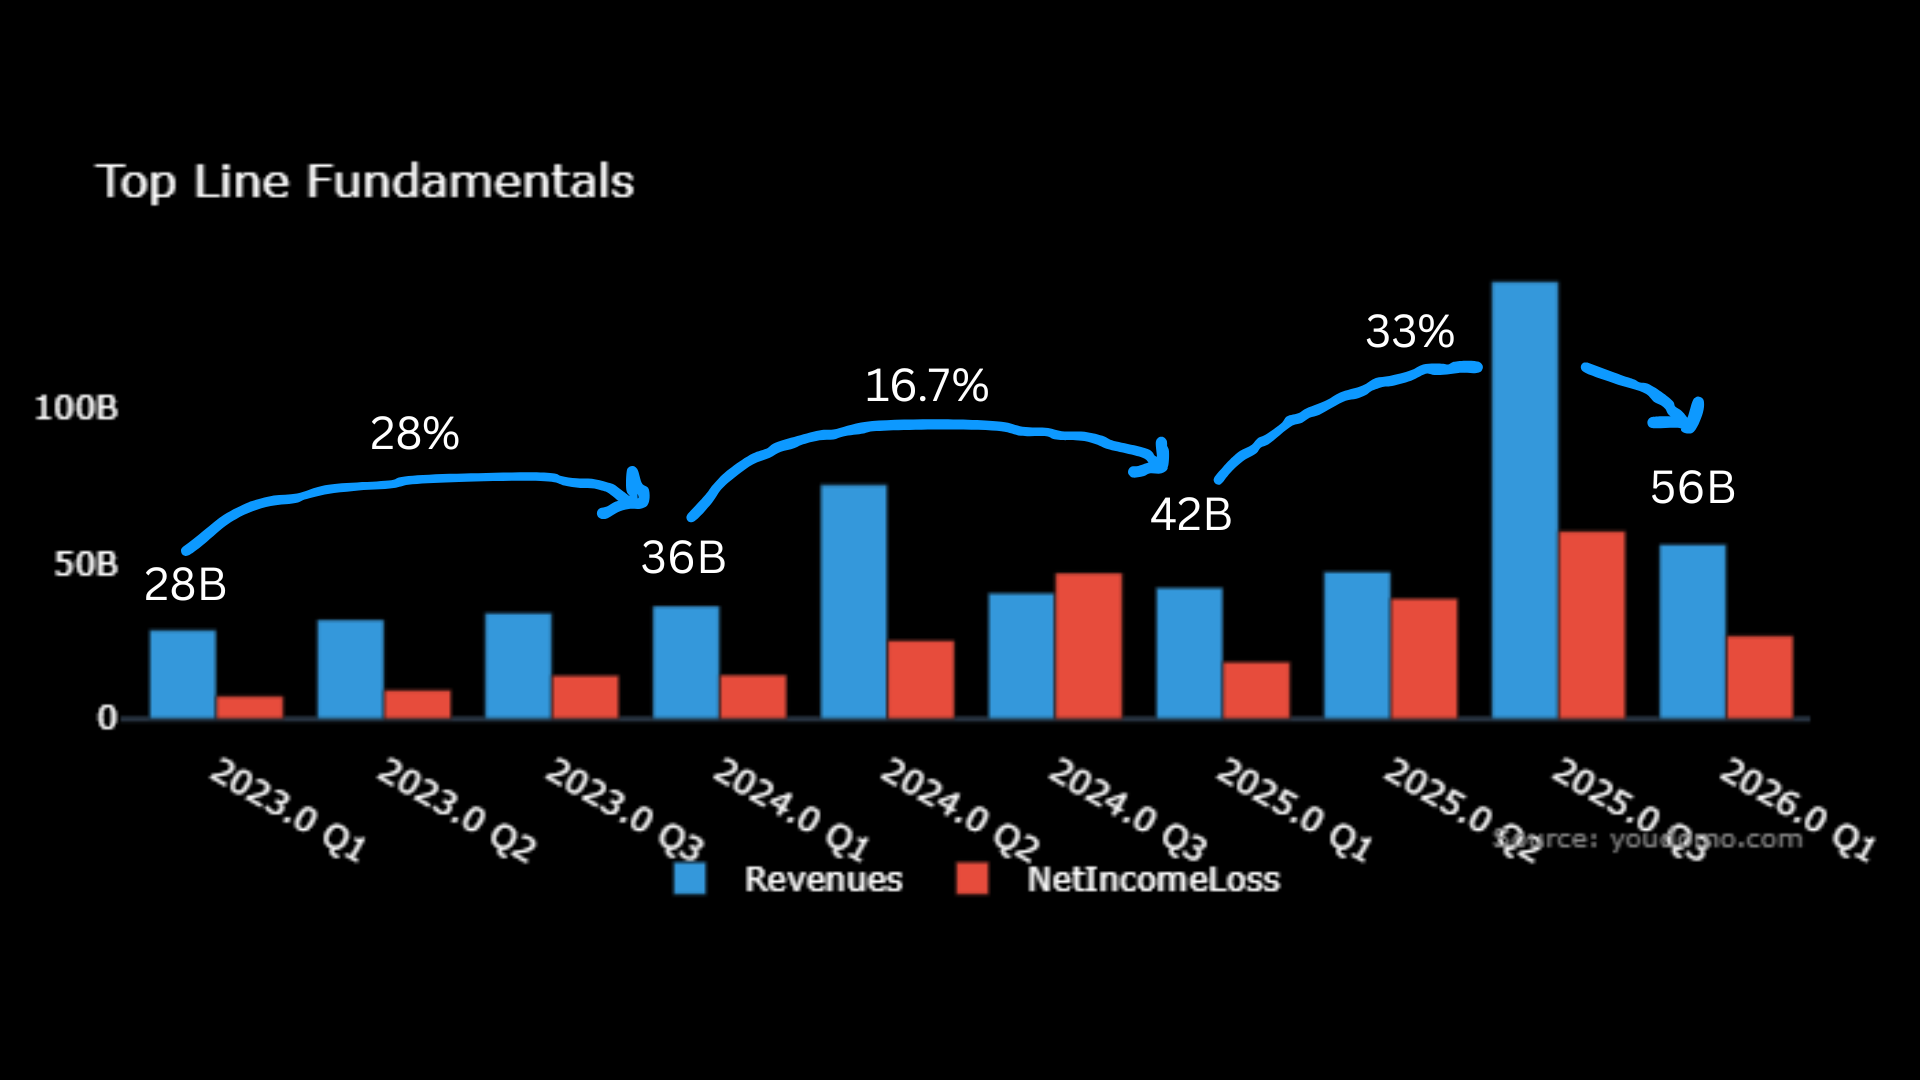
To justify spending at that scale, META needs to show real growth in the coming quarters — and so far, the early numbers back it up. Q1 revenue grew 33% year-over-year, and net income grew 61%, both faster than 2024's 28% revenue growth rate and 2025's 16.7% rate. That acceleration is happening at the same time as the CapEx hikes, as META has said it is "committing over $600 billion in the US by 2028 to support AI technology, infrastructure, and workforce expansion" (Seeking Alpha).
It's also worth noting that some of META's recent active-user softness has nothing to do with product weakness — it's tied to internet disruptions in Iran and WhatsApp restrictions in Russia. Strip out those geopolitical events and META would have shown daily active people (DAP) growth. The underlying user base is still growing.
Who Are the "Aggregators of AI"?
Right now, the clearest AI winners in the market are the bottleneck companies — the chip makers and data center operators powering AI models. But those businesses are typically cyclical. What happens the day supply finally catches up with demand? Will chip and memory names keep winning once power and memory efficiencies bring costs down and the supply bottleneck disappears?
Instead of buying the shovels, it's worth asking who the aggregators of AI will be — the companies that generate revenue because of AI, not just from selling the infrastructure underneath it. Who increases user engagement, improves user experience, and grows revenue thanks to AI? Which companies will consumers actually be interacting with, powered by AI, five, ten, twenty years from now?
A few aggregators stand out:
- Amazon: AI helps predict what customers will buy next, enabling better product recommendations and pre-positioning inventory closer to customers before they even order — supporting faster, same-day shipping. Amazon's Zoox robotaxi effort (like Google's Waymo) applies AI to autonomous driving and eventually autonomous package delivery, while AI-driven warehouse robotics cuts operational cost and error. AWS also captures B2B AI demand directly.
- Alphabet (Google): Gemini drives research and coding assistance, AI-powered search features are increasing Google Search usage, and Google Cloud captures B2B AI workloads.
- META: AI models predict which video a user is likely to watch next on Facebook and Instagram, and which ad they're most likely to click and buy, increasing both engagement and ad impressions. META is also moving into AI-integrated hardware — deliberately avoiding the position Apple is in, where Siri has to lean on Google and ChatGPT for AI capability. META wants to own its own ecosystem end to end: hardware powered by its own proprietary models, and software that keeps users engaged and generates ad revenue.
META Fundamentals: Valuation Multiples at a Discount
Using the YouDomo API, you can pull financial data for over 3,500 stocks — annual and quarterly balance sheet, income statement, and cash flow line items — and build out a full valuation picture in Excel in minutes. That's exactly how the numbers below were built: revenue, net income, free cash flow, and valuation multiples, all sourced directly from META's filings.
Right now, META is trading at a discount relative to its own historical averages:
For context, META traded as low as $100 per share in 2022, when these same valuation multiples hit their lowest point of the past ten years — the absolute bottom for the stock in recent history. Today's multiples aren't back at 2022 levels, but they're becoming noticeably more attractive.
Valuation vs. Return: What Price-to-Sales Predicts
The YouDomo API also makes it possible to plot a stock's forward return directly against its valuation multiple at the time. For META, that relationship with price-to-sales is clearly inverse: as P/S rises, one-year forward return tends to decline. Correlation isn't causation, but the pattern is consistent — stock appreciation shows up more often when META is trading at a valuation discount.
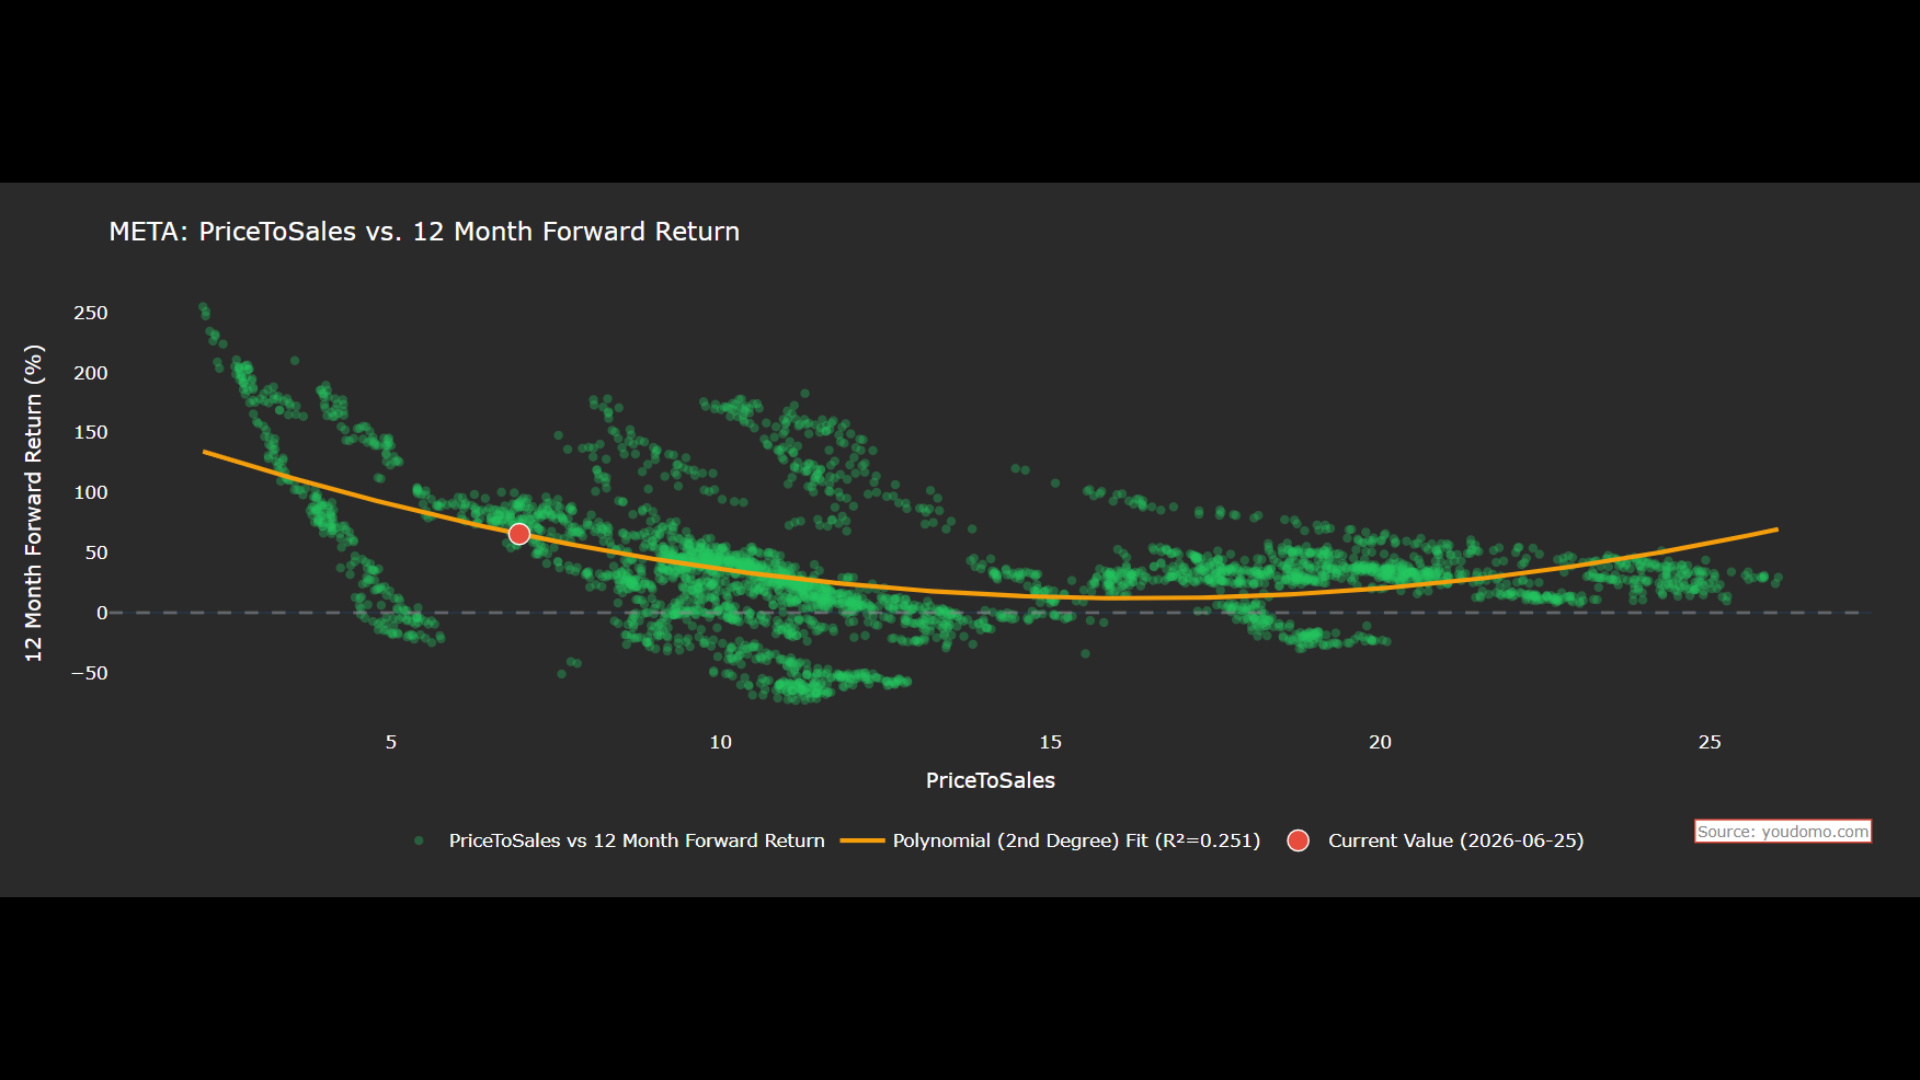
META's current price-to-sales sits at 7.6. Based on this relationship, that implies a one-year price return between annual report filing dates of roughly 50%. It's worth being clear-eyed about the sample: this return data spans 2012 through 2026, a period that's been mostly bullish for equities overall, with the main pullbacks concentrated in 2020 and 2022.
2026 Revenue and Free Cash Flow Forecast
Historically, META's revenue, operating cash flow, and capital expenditure move closely together. Based on Q1 actuals, Q2 guidance, and forecasted Q3 and Q4 results, projected 2026 revenue lands around $250 billion. If that holds, operating cash flow should come in near $134 billion, against roughly $72 billion in capital expenditure — putting 2026 free cash flow around $62 billion, a roughly 35% annual growth rate.
That growth estimate matters because of what the market appears to be pricing in. Using the Gordon Growth Model against META's current market cap, the market looks to be implying an annual free cash flow growth rate of only around 6% — well below the 35% growth rate this forecast projects. That gap between the market's implied growth rate and a more optimistic bottom-up forecast is exactly the kind of divergence that can signal mispricing.
To be clear, META can absolutely trade lower before any turnaround plays out. But if management can keep proving that AI spending is translating into real business growth — in engagement, in ad performance, in revenue — there's a real case for meaningful appreciation from here.
Final Verdict: Is META Stock a Buy or Sell in 2026?
META's underperformance in 2026 looks more like a valuation reset than a breakdown in the business. Revenue and net income growth are accelerating even as CapEx guidance climbs, valuation multiples are meaningfully below their historical averages, and the price-to-sales-implied return model points toward significant upside if META can keep converting AI spending into engagement and ad revenue. The main risk is patience: if free cash flow stays compressed longer than expected, shares could see further downside before any re-rating shows up.
This article is for information and education only and is not financial advice. Do your own research, or consult a licensed financial advisor, before making investment decisions. Past performance does not guarantee future results.