McDonald's stock is down 21% from all-time highs this year. For a Dividend King with over 45 consecutive years of dividend increases, that kind of pullback naturally raises the question: is MCD a buy today?
Holistically, McDonald's financials are performing well — the pullback looks more like a valuation reset than a business breakdown. Let's walk through the fundamentals, the valuation, and what a quant model built on Domo Lab says about buying MCD at today's price.
MCD Financials: Revenue, Net Income, and Free Cash Flow Growth
You can pull McDonald's full financial history and visualize it in seconds on youdomo.com. Revenue has increased from $19 billion to $26 billion over the past five years — 36% growth. Net income grew even faster, up 85% from $4.7 billion to $8.7 billion over the same period.
That top-line growth has trickled all the way down to the free cash flow line as well. Free cash flow grew 54% over the past five years, from $4.6 billion to $7.1 billion.
MCD Growth Rates vs. the Restaurant Industry
YouDomo.com also lets you compare a stock's financial growth rates and valuation ratios directly against its industry average. On growth, McDonald's is right in line with its peers: revenue grew 5.8% year-over-year from 2024 to 2025, compared to a restaurant industry average of 6%. McDonald's isn't outgrowing the industry right now — but it isn't falling behind it either.
MCD Valuation: A Price-to-Sales Premium for Brand Reliability
Where McDonald's stands out is valuation. MCD trades at a significant premium from a price-to-sales perspective — a P/S of 8.3 compared to a sector average of 2.5. Investors are effectively paying up for McDonald's national and international brand reliability, not just its current sales figure.
That premium narrows considerably on other metrics, though. On a price-to-net-income and price-to-free-cash-flow basis, McDonald's trades much closer to the industry average — meaning investors are willing to pay similar prices for McDonald's actual profit and cash generation as they are for the rest of the sector. The premium is really concentrated in the sales multiple, not in earnings or cash flow.
Quant Analysis: Does MCD's Valuation Predict Stock Returns?
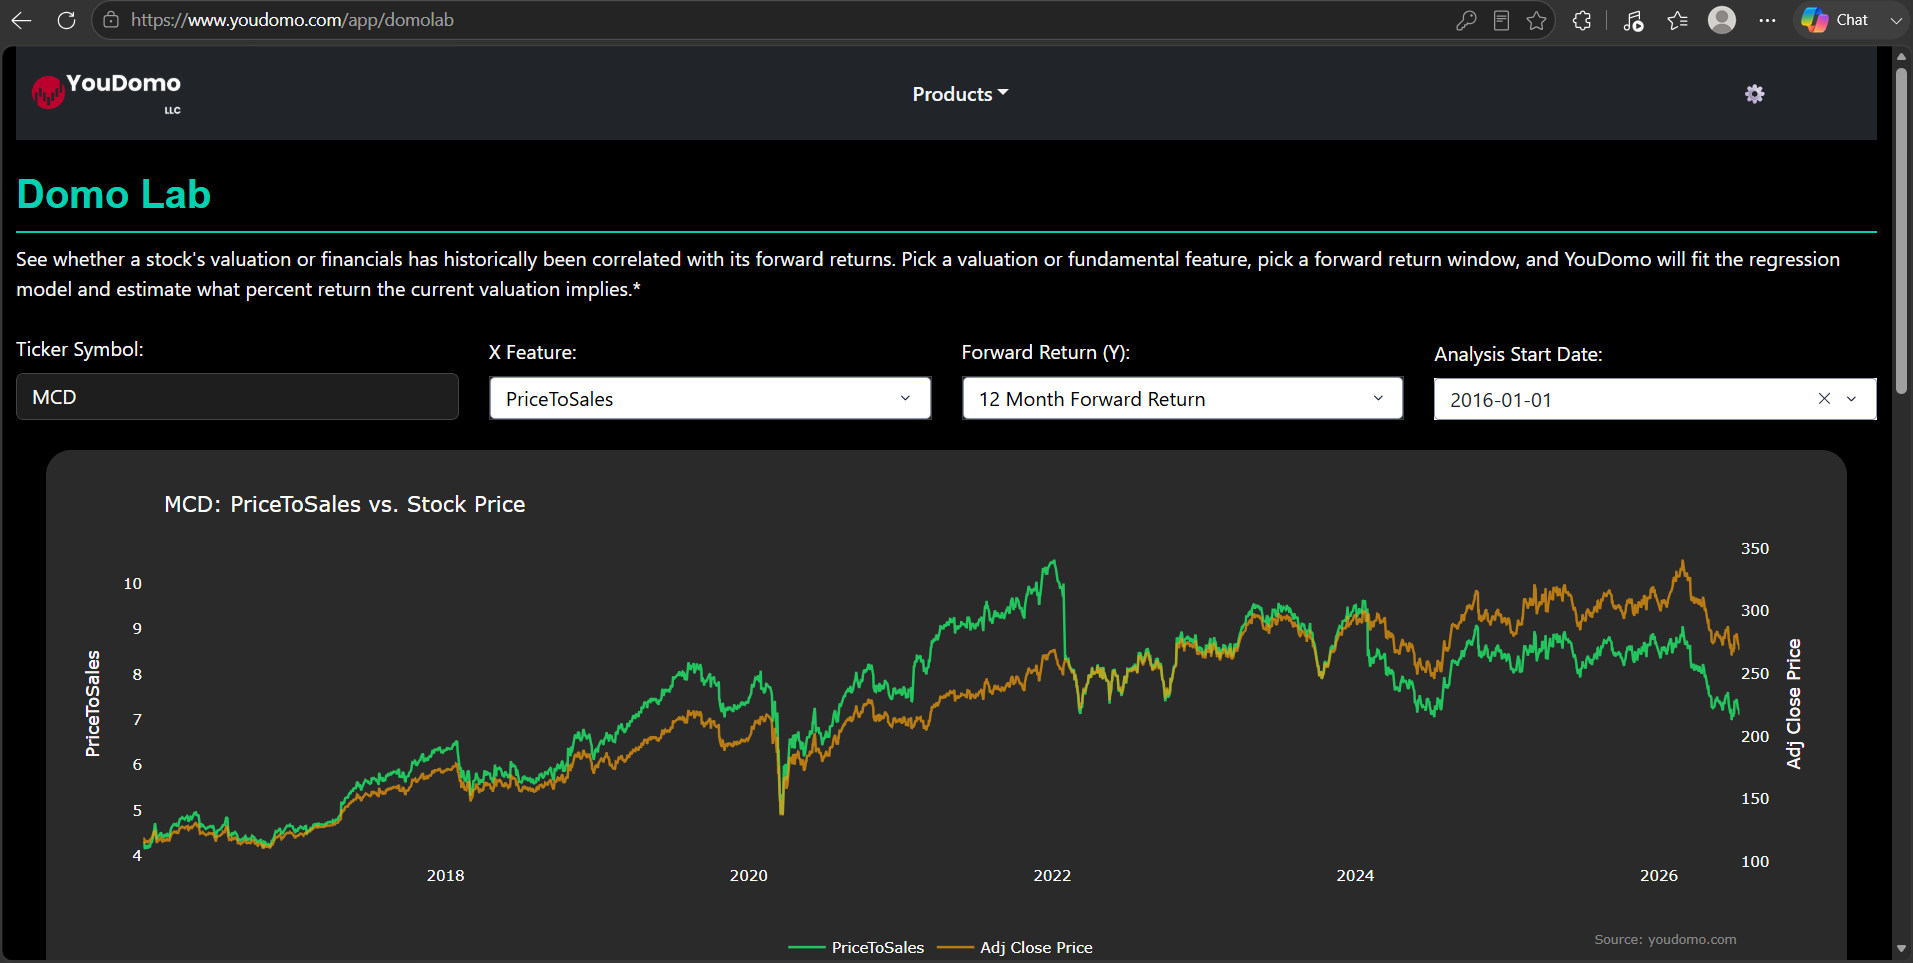
Domo Lab on youdomo.com runs quant analysis to see which features of a stock are historically correlated with its returns. Plotting McDonald's price-to-sales against its stock price over time shows the two tracking closely together for most of the past decade.
But how do you actually tell whether price-to-sales is correlated with better forward returns? For that, Domo Lab plots a scatter chart of price-to-sales against MCD's annual percent return. The result shows a slight inverse trend: as price-to-sales rises, MCD's forward percent return tends to decline.
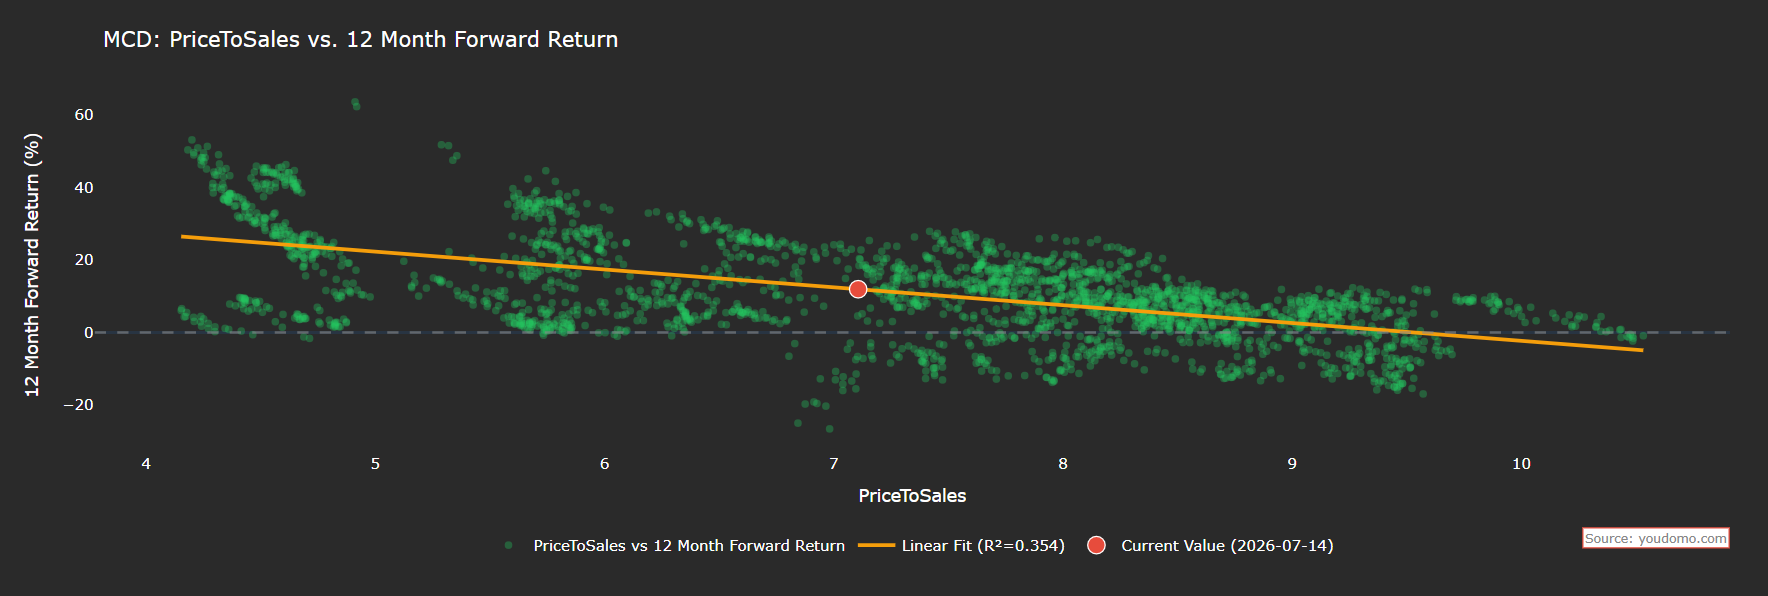
Notably, McDonald's price-to-sales has fallen back to 7. MCD was also trading around a P/S of 7 in June 2024, in March 2022, during the COVID recovery in 2020, and back in 2018 — and each of those windows turned out to be a strong entry point for the stock. The correlation plot backs this up: the fit line is clearly downward-sloping, meaning higher price-to-sales has historically come with lower forward returns. The model's R-squared has also improved from 0.09 to 0.35, adding real confidence to the relationship.
Final Verdict: Is MCD Stock a Buy or Sell in 2026?
McDonald's fundamentals — revenue, net income, and free cash flow — have all grown meaningfully over the past five years, and growth rates remain in line with the restaurant industry. The stock's price-to-sales premium reflects a real brand moat, but that same multiple has now pulled back to a level, 7x, that has historically marked strong entry points, with a Domo Lab regression model showing a strengthening inverse relationship between valuation and forward returns. For a Dividend King trading 21% below its highs, this looks like a reasonable level to be a long-term buyer.
This article is for information and education only and is not financial advice. Do your own research, or consult a licensed financial advisor, before making investment decisions. Past performance does not guarantee future results.