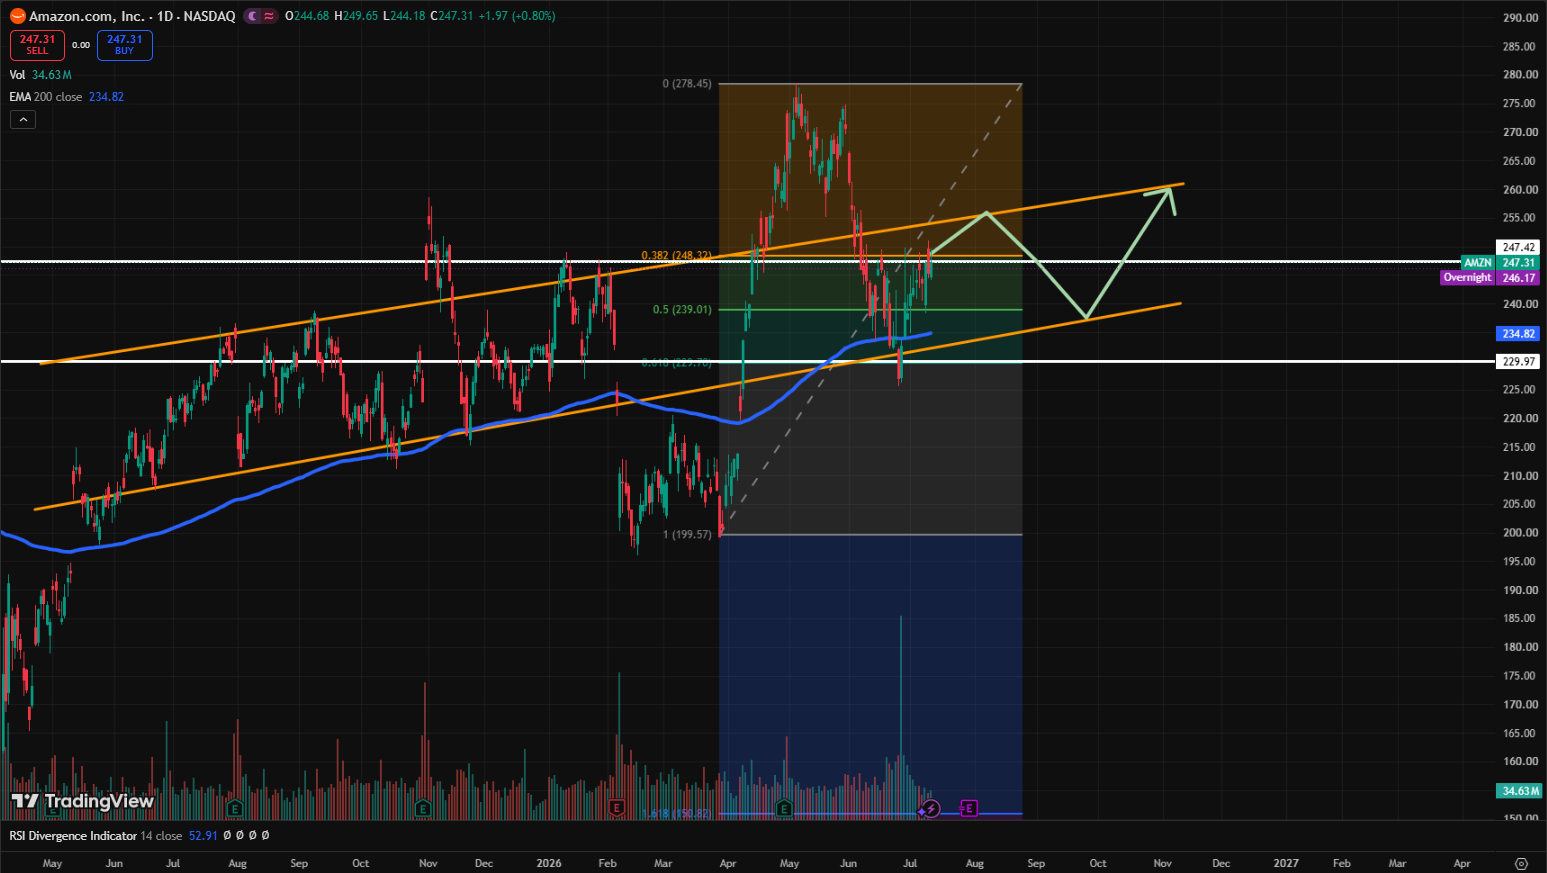
Amazon is allocating $200 billion toward AI infrastructure and just raised another $25 billion in bond sales to keep funding data center and chip expansion. AMZN stock is up roughly 9% year-to-date, trailing the S&P 500's 10% gain, and shares have pulled back from an all-time high near $275 to around $247 today.
Investors are worried this AI capital expenditure cycle won't pay off the way it's supposed to. What if compute supply outpaces demand and AWS growth slows because customers suddenly have more cloud options? Meta is exploring becoming a neo-cloud provider. Microsoft Azure and Google Cloud already sell compute for AI workloads. SpaceX is even renting out GPU capacity from its Colossus data centers to AI labs like Anthropic and Google.
So is Amazon stock a buy or a sell right now — an AI opportunity, or a company burning too much cash? Let's break down the technicals, the fundamentals, and the valuation.
Amazon Stock Technical Analysis: Fibonacci Support & RSI Divergence
AMZN currently has a textbook Fibonacci setup. In a healthy Fibonacci recovery, I look for three things to line up: price finding support at the EMA 128 or EMA 200, that support also sitting near a key Fibonacci retracement level (0.382, 0.5, or 0.618), and that same level having acted as a previous resistance or support zone. Amazon checks all three boxes right now — the stock has recovered back above its EMA 200, the $233 resistance line, and the 0.618 retracement level.
There's also a bullish RSI divergence in play: the RSI has been printing higher lows while AMZN price made lower lows, a classic signal that downside momentum is fading even while the stock still looks weak on the surface. This Fibonacci recovery is further reinforced by an uptrend support line running underneath the price action.
The next test for Amazon is breaking through resistance at $246.15, a ceiling that has rejected AMZN three separate times across Q4 2025 and Q1 2026, and which happens to sit right near the 0.382 retracement level.
Fundamental Analysis: Amazon Revenue, Net Income, and the 2022 Anomaly
Amazon's annual revenue growth has been consistently strong year over year — you can pull this chart yourself for free on youdomo.com. Net income tells a similar growth story, with one glaring exception: 2022 is the only year of negative net income in Amazon's recent history. What happened?
After Rivian went public in late 2021, its stock price spiked, handing Amazon an $11.8 billion net income boost that year purely from its equity stake. But in 2022, Rivian's stock collapsed roughly 82%, forcing Amazon to record a $12.7 billion pre-tax valuation loss — enough on its own to drag full-year net income into the red.
Amazon was also dealing with overcapacity and overstaffing. The company had aggressively doubled the size of its fulfillment network in 2020 and 2021 to meet pandemic-driven demand. When consumer behavior normalized in 2022 and shoppers returned to physical stores, Amazon was left with excess warehouse space and headcount.
In other words, the 2022 net income dip wasn't a crack in Amazon's competitive moat — it was a combination of a one-time investment write-down and macro whiplash after the pandemic. Net income has grown every year since.
Why Amazon's Free Cash Flow Went Negative: The CapEx Explosion
Free cash flow tells an even choppier story, with FCF dropping to roughly -$14 billion and -$16 billion in 2021 and 2022. Here's what drove it.
When pandemic e-commerce demand exploded, Amazon's leadership made an aggressive bet: double the size of the entire fulfillment network in just 24 months. That meant a historic capital expenditure cycle — over $61 billion in CapEx in 2021, followed by another $58 billion in 2022. Roughly $120 billion in cash went into warehouses, data centers, sorting facilities, and delivery vans in just two years, completely outpacing incoming cash and pushing free cash flow negative.
Investors punished the stock for it. From January 2021 through the end of 2022, Amazon shares fell 48%. Negative free cash flow means less capacity for buybacks, dividends, debt paydown, or simply holding cash — and the market reacted accordingly.
E-commerce spending kept climbing well past the pandemic. Quarterly e-commerce spend went from $33 billion in Q1 2009 to $156 billion in 2020, then jumped another 33% to $208 billion by Q2 2020 during lockdowns, and now sits at $326 billion as of Q1 2026. Even adjusted for inflation, e-commerce spend has grown from roughly $15 billion in 2009 to the equivalent of $100 billion in 1984 dollars today. Because Amazon built and upgraded its fulfillment network early, it was positioned to capture an outsized share of that growth.
The Regionalization Pivot That Unlocked 2024–2025 Margins
Amazon originally ran a centralized, national fulfillment model — shipping a product from a warehouse in California to a customer in New York, for example — which created major shipping inefficiencies. Once the company had excess physical capacity from its CapEx buildout, CEO Andy Jassy restructured the entire footprint into eight self-contained geographic regions.
The result: inventory sits closer to customers, which drastically lowered Amazon's cost-to-serve while simultaneously speeding up delivery. By 2025, U.S. Prime members received over 8 billion items same- or next-day, a 30% year-over-year surge. That same efficiency gain pushed Amazon's North American operating margins to historic highs — climbing to 9% by late 2025 — funneling tens of billions of dollars in pure profit back into the business.
Supply Chain by Amazon: Turning Excess Warehouses Into a New Business
Rather than let underused warehouse space sit idle, Amazon did what it already did once with AWS: it turned internal infrastructure into an external enterprise product. The result is Amazon Supply Chain Services, a fully outsourced third-party logistics (3PL) offering.
Merchants can now use Amazon's warehousing and logistics network to fulfill orders that originate on Shopify, Walmart, eBay, and TikTok Shop — an individual seller can even connect a TikTok Shop storefront to Amazon's Seller Central to tap into Amazon's delivery network. By opening its excess capacity to off-platform commerce, Amazon unlocked a high-margin revenue stream that asset-light competitors can't easily replicate. It's the same playbook that turned spare AWS server capacity into a hundred-billion-dollar cloud business — and it's worth watching for the same pattern to repeat if Amazon's AI data center buildout ends up ahead of near-term demand.
How Amazon's Fulfillment Moat Out-Muscled Shopify, Temu, and Shein
In 2022 and 2023, low-cost disruptors like Temu and Shein aggressively chipped away at budget retail. But those platforms depend on fragmented cross-border shipping. Because Amazon had already absorbed the financial pain of building a massive domestic footprint, it had an almost unassailable advantage: localized speed that's extremely difficult to replicate from overseas.
Shopify tried to compete directly in fulfillment — and failed, which says a lot about how deep Amazon's moat really is. Shopify acquired the logistics provider Deliverr for $2.1 billion in 2021, when pandemic e-commerce tailwinds and a federal funds rate near 0.08% made that kind of expansion cheap. The bet didn't work: the acquisition helped push Shopify's net income to -$3 billion in 2022, and Shopify sold Deliverr off just a year after buying it.
That Shopify fulfillment bet and quick reversal came up in an earlier YouDomo Shopify stock analysis, where the call was to favor Amazon over Shopify. Since then, Amazon is up 18% while Shopify is up only 8% — evidence of just how high the barrier to entry is in fulfillment, and why Amazon continues to benefit from a lack of credible competition in the space.
Amazon's $200 Billion AI and Data Center Bet
Amazon is now running a very similar playbook with AI. The company is pouring roughly $200 billion into AWS infrastructure to meet surging demand for AI compute from businesses and consumers. The core question: will this AI spend pay off the way the fulfillment buildout did? Long term, the data leans toward yes.
Amazon has said AWS growth has re-accelerated thanks to AI demand — enough that new neo-cloud entrants like SpaceX, Qualcomm, and Meta are all trying to get into the compute-selling business. The debt load is worth watching, but this isn't a blind bet: current AI compute demand is running well ahead of supply. Amazon's own Q1 results show AWS net sales up 28% year-over-year, a re-acceleration into double-digit growth.
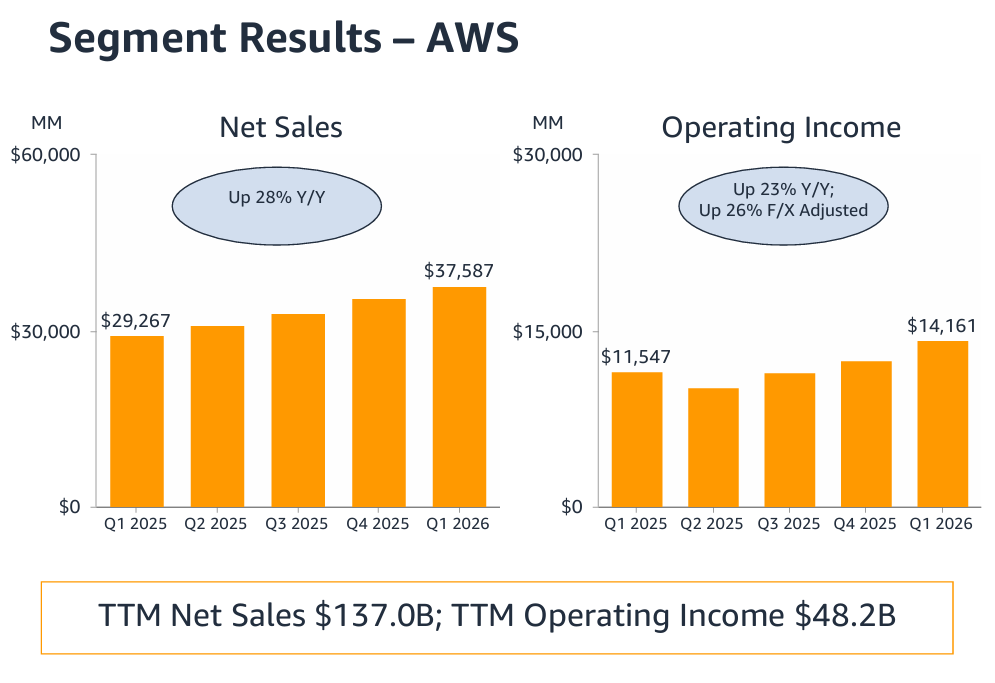
This is exactly where short-term investors get nervous. Free cash flow is falling fast — down roughly 95% year-over-year — and is at real risk of turning negative again.
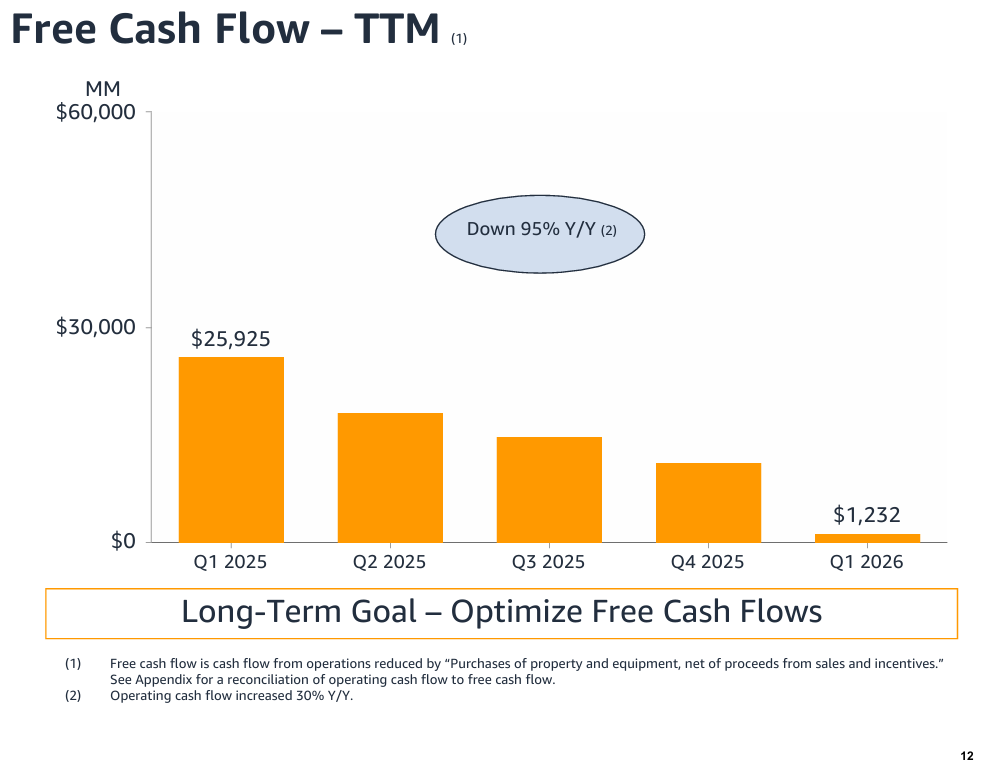
This is a near carbon copy of the 2021 setup. The opportunity was surging e-commerce demand; the response was doubling the fulfillment network by taking on debt and running negative free cash flow for two straight years; the payoff was a dominant shipping and delivery moat that competitors couldn't replicate, followed by $32 billion in free cash flow within two years once the spending cycle ended.
You can plot this exact relationship between Amazon's stock price and free cash flow yourself on youdomo.com. In the short term, the market punished Amazon for the 2022 negative free cash flow stretch — shares fell from a high of $169 to a low of $81 that winter, a 52% decline. But notice that AMZN started recovering well before annual free cash flow actually turned positive again in 2023. Waiting for the free cash flow number to flip positive would have meant missing the recovery entirely.
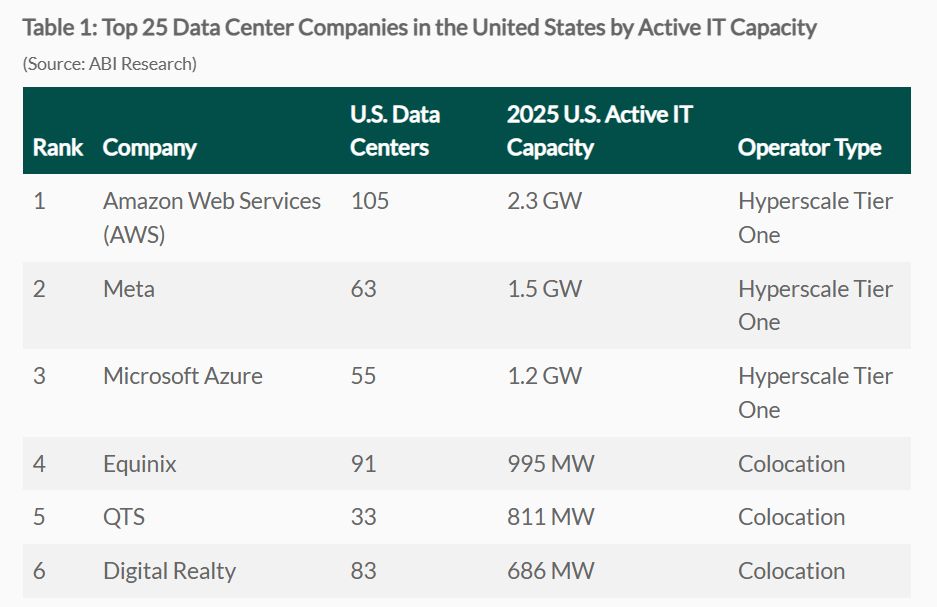
That's the same dynamic playing out with AI today. Amazon's goal is to defend its data center market share the same way it defended e-commerce — and right now, Amazon holds more than double the gigawatt capacity of the second-place provider, Meta.
To be clear, downside risk is real. Amazon fell 52% during its previous negative free cash flow cycle. Applying that same decline to Amazon's more recent high near $274 would put a bearish downside scenario around $131 per share if history repeats. But just as e-commerce demand surged in 2020, AI compute demand is surging now — and Amazon intends to fulfill it while defending its number one position in data centers, backed by its own Trainium and Inferentia chips that reduce reliance on Nvidia and lower unit costs over time.
Amazon Valuation: What Price-to-Sales Predicts for Returns
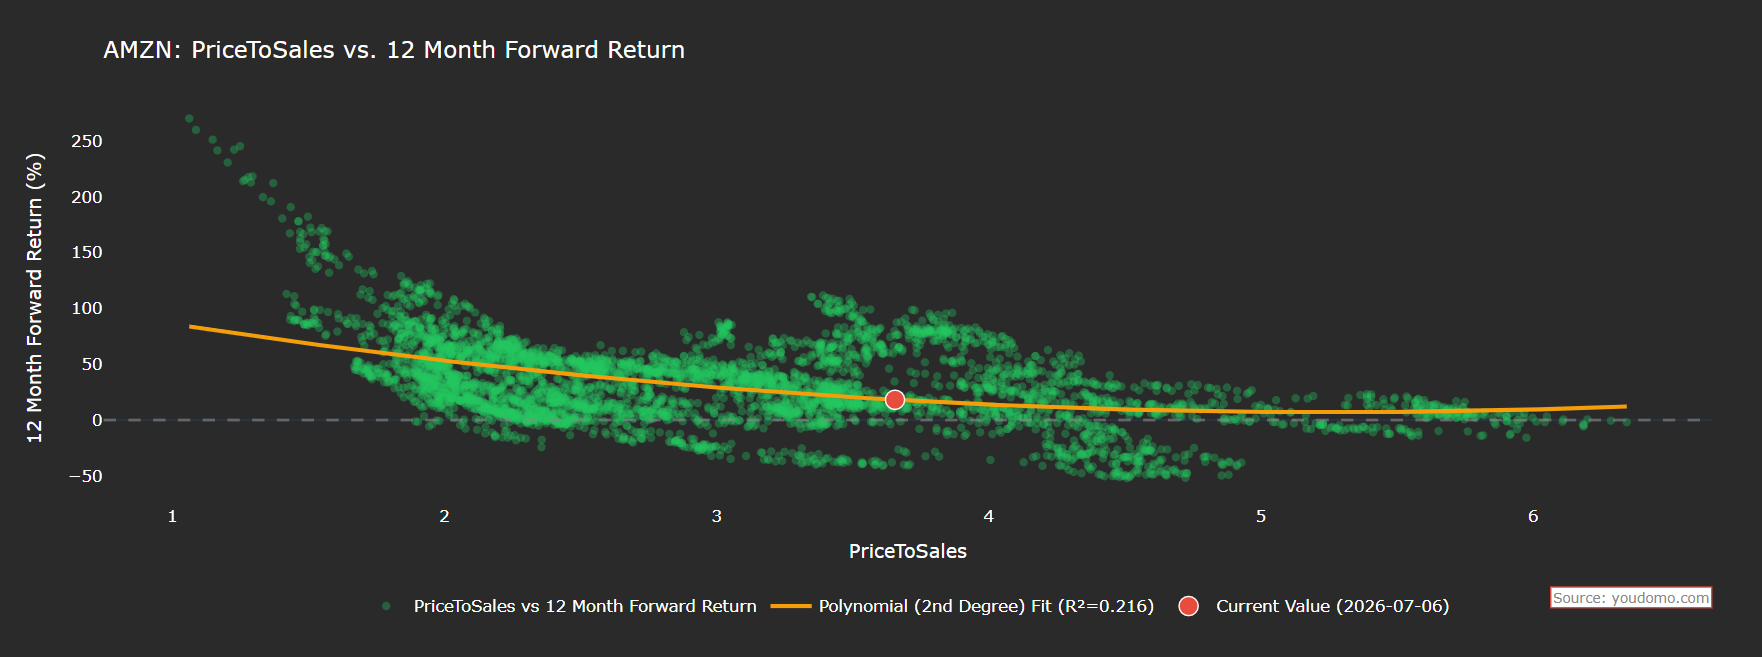
Amazon's revenue keeps climbing, and you can plot annual revenue against AMZN's stock price directly on youdomo.com. You can also chart price-to-sales against forward stock returns to see whether Amazon's valuation is actually correlated with performance.
AMZN is currently trading at an annual price-to-sales ratio of 3.6x — the same level it traded at in March 2020. Plotting stock returns against each historical price-to-sales value shows a negative slope: as Amazon's price-to-sales rises, the odds of strong forward returns fall. At the current 3.6x multiple, the data implies an estimated annual return of roughly 18%.
This is the kind of analysis that separates YouDomo from typical stock research tools — a data science and quant-driven approach to valuation that's still simple enough to use in a few clicks.
2026 Amazon Revenue and Free Cash Flow Estimates
Amazon's $200 billion AI capital expenditure plan is well known at this point. Financials for this analysis were pulled straight into Excel using the YouDomo Financial API — you can get a free API key at youdomo.com. Many analysts are modeling roughly 11% revenue growth, which would put 2026 revenue around $795 billion. Since operating cash flow tends to move closely with revenue, that implies operating cash flow near $137 billion.
Against $200 billion in CapEx, that puts estimated free cash flow around negative $62 billion for 2026 — though some analyst estimates land closer to positive $45 billion, depending on how CapEx is phased through the year.
This is a genuinely large bet, and it costs real upfront capital. Amazon is doing it to defend its number-one data center position the same way it defended fulfillment — while also competing directly with Nvidia through its own Trainium and Inferentia chips, and automating warehouses with AI-driven robotics to improve efficiency per headcount. Shares can absolutely go lower in the short term as investors fear negative free cash flow and rotate into more historically cyclical memory and chip names.
Final Verdict: Is AMZN Stock a Buy or Sell in 2026?
Long term, Amazon looks well positioned to repeat its fulfillment-era playbook with AI: absorb short-term free cash flow pain now to defend a market-leading position later. The technical setup, the historical CapEx-to-FCF pattern, and the price-to-sales-implied ~18% forward return all point toward AMZN as a buy for long-term investors — with the understanding that near-term volatility, including a potential drawdown toward the $131–$150 range, is a real possibility if free cash flow turns sharply negative.
This article is for information and education only and is not financial advice. Do your own research, or consult a licensed financial advisor, before making investment decisions. Past performance does not guarantee future results.